2.1.2. Categorical Data Analysis
Many UNISTAT procedures offer the possibility to perform analyses on or between subgroups of data columns, as defined by one or more factor columns (i.e. categorical variables). Usually, selection of a factor variable is optional. If at least one factor column is selected, then a further dialogue will pop up, displaying a check list of all levels (i.e. the distinct values) of the factor. If two or more factor columns are selected, combinations of levels in selected factors will be listed.
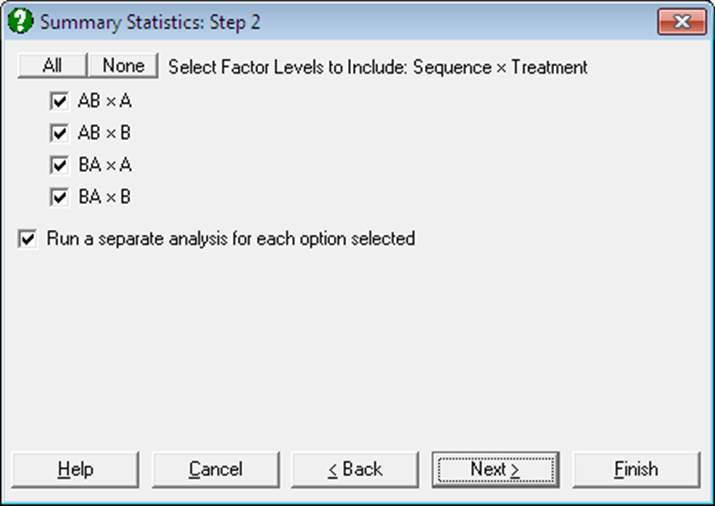
There will also be a check box Run a separate analysis for each option selected, which is used to determine whether the variables or the factors will take priority. When this box is checked, the test will be performed on or between variables for each level combination checked. In other words, factors will be in the outer loop. When the Run a separate analysis for each option selected box is unchecked, then the program will perform the procedure on or between all selected levels (or combinations of levels) of factor columns, for each variable. In other words, variables will be in the outer loop. Note that this check box may have slightly different semantics in different groups of procedures. For an example demonstrating this point see 5.1.1. Summary Statistics.
When the list of levels (or level combinations) is displayed, all entries will be checked by default. You can uncheck all by clicking on the None button on top. However, if you wish to have all boxes displayed unchecked on entry, enter the following line in Unistat10.ini file under the [Options] section:
CheckAllFirst=0
By default, the Run a separate analysis for each option selected box is displayed checked. Enter the following line in Unistat10.ini file under the [Options] section in order to display this box unchecked on entry:
RunSeparate=0
When the program determines the levels of a factor, by default, it sorts them alphabetically in increasing order. If you wish to have factor levels displayed unsorted, i.e. in the order of their occurrence in each factor column, then enter the following line in Unistat10.ini under the [Options] section:
SortFactorLevels=0
The way the categorical analysis option works is slightly different in each of the following three groups of procedures.
Multisample Data
In this group of procedures, where [Variable] and [Factor] lists are displayed together, it is optional to select a factor variable. If no factor variables are selected, then the test is performed on the selected variables with no categorisation. If at least one factor variable is selected, then it is possible to run the analysis on subgroups defined by the combination of factor levels. Procedures in this category are as follows:
Graph → 2D Plots →
Graph → Charts →
Graph → Descriptive Plots →
Box-Whisker, Dot and Bar Plots
Statistics 1 → Descriptive Statistics →
Statistics 1 → Parametric Tests →
Statistics 1 → Goodness of Fit Tests →
Statistics 1 → Nonparametric Tests (Multisample) →
Two Independent Samples Data Option
Tests for two unrelated samples allow selecting an unlimited number of factors as in the multisample data option above. These procedures are:
Statistics 1 → Parametric Tests →
Statistics 1 → Goodness of Fit Tests →
Statistics 1 → Nonparametric Tests (1-2 Samples) → Unpaired Samples →
Hodges-Lehmann Estimator (Unpaired)
However, unlike the multisample data option, these procedures support two additional data types (see 6.0.2. Two Sample Tests).
Matrix Data
In procedures where data is supplied in matrix format, it is possible to select one or more factors in order to define the groups of cases to be included in the analysis. It is then possible to run a separate analysis on each subsample in one go, or to run a combined analysis on all selected subsamples. The procedures where this feature is available are:
Statistics 1 → Matrix Statistics
Statistics 1 → Regression Analysis →