7.2.3. Stepwise Regression
Stepwise Regression provides an answer to the question of which independent variables to include in the regression equation.
The simplest way to isolate the effects of various independent variables on the variation of dependent variable would be to start with one independent variable and run a series of regressions adding one independent variable at a time. An alternative would be to start with all independent variables and omit one at a time. Indeed, these are the two basic procedures most commonly used in Stepwise Regression, but with a difference. Rather than adding or omitting variables randomly it is possible to introduce a statistically meaningful criterion to rank the sequence. The enter/omit criteria used here are the F-to-enter, F-to-remove and Tolerance parameters.
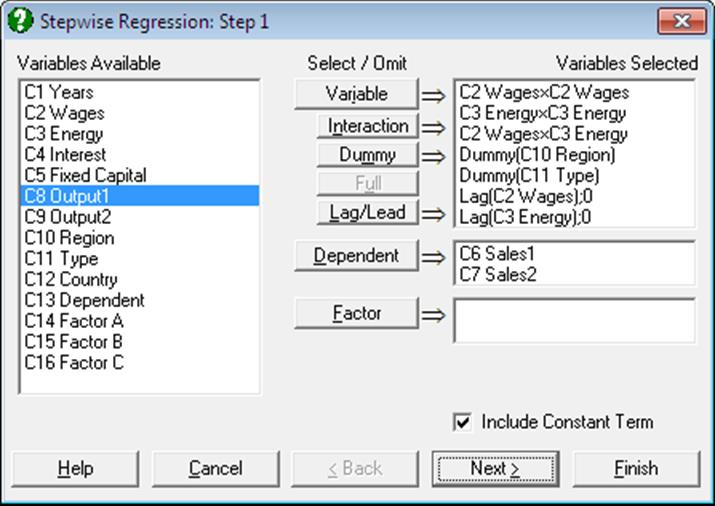
As in Linear Regression, it is possible to create interaction terms, dummy variables, lag/lead terms, select multiple dependent variables and run regressions on subsamples defined by several factor columns (see 7.2.1.1. Linear Regression Variable Selection). However, a weights option is not included. The set of independent variables selected or created are the candidates for inclusion in the regression equation. The stepwise procedure will not consider columns that are not in the Variables Selected list.
7.2.3.1. Stepwise Selection Criteria
The next dialogue is for selecting the Tolerance, F-to-enter and F-to-remove thresholds. One of Forward Selection or Backward Selection methods is also specified on this dialogue.
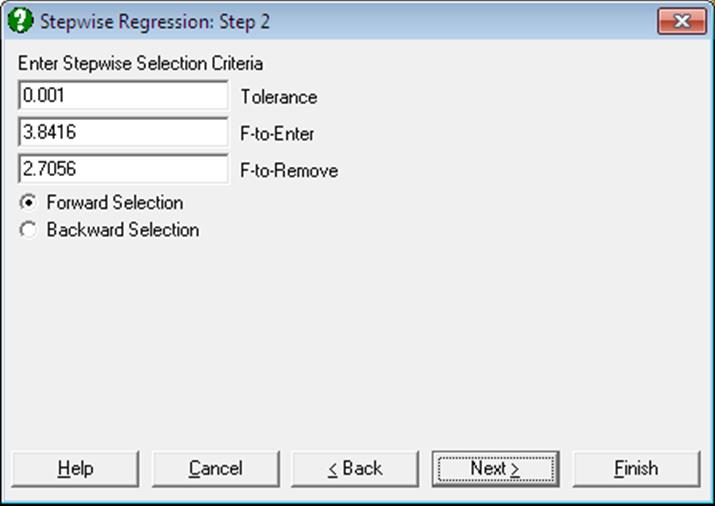
The values suggested by the program are the most commonly used limits. Of course, it is possible to enter any value of choice by editing the number in the field. UNISTAT allows entry of F-values only as enter / remove thresholds. If you wish to enter tail probability values instead, the corresponding F-values can be calculated easily using the Statistics 1 → Distribution Functions → Critical Value procedure. The complement of the desired tail probability value (1 – α) should be entered in the Probability dialogue, and numerator and denominator degrees of freedom should be entered as 1 and 100,000 (representing infinity) respectively. The critical value obtained in this way can then be used in the Stepwise Regression procedure.
F-to-Enter: The F-to-enter statistic of an independent variable is the F-statistic for testing the significance of the regression coefficient it would have if it were in the regression equation. If this calculated value is above the one specified by the user, then the variable can enter the equation. The default value is 3.8416, corresponding to a tail probability value of 0.05 (with 1 and 100,000 degrees of freedom) and it must always be greater than the F-to-remove value. If you wish to change this default value permanently, enter and edit the following line in the [Options] section of Documents\Unistat10\Unistat10.ini file:
StepwiseFtoEnter=3.8416
F-to-Remove: The F-to-remove statistic of an independent variable which is already in the regression equation is the F-statistic for testing the significance of its regression coefficient. If this calculated value is below the one specified by the user then the variable is removed from the equation. The default value is 2.7056, corresponding to a tail probability value of 0.10 (with 1 and 100,000 degrees of freedom) and it must always be less than the F-to-enter value. If you wish to change this default value permanently, enter and edit the following line in the [Options] section of Documents\Unistat10\Unistat10.ini file:
StepwiseFtoRemove=2.7056
Tolerance: In order to avoid highly correlated variables and also to prevent accumulation of rounding errors, a Tolerance value is specified. The Tolerance of a variable which is not in the equation is defined as 1 – R-squared where R is the multiple correlation between the variable and all variables which are in the regression equation. If you wish to change this default value permanently, enter and edit the following line in the [Options] section of Unistat10.ini:
StepwiseTolerance=0.001
Forward/Backward Selection: If the Forward Selection method is employed, then the program will first run a regression with the most likely candidate, and then successively introduce other variables or omit existing ones. If the Backward Selection method is selected, then the program will first run a regression with all independent variables included and then proceed with the omission process. In this case, the output will also include a full regression output in the beginning.
It is important to emphasise that neither F-to-enter or F-to-remove, nor the Tolerance of a variable (either in the equation or not) remains the same when a variable is added to or removed from the regression equation. Therefore, whenever an addition or omission takes place, all variables, regardless of being in the equation or not, are made subject to the above checks. When the last of the independent variables is tried for entry or removal and no variables can be entered or removed, then the selection process is terminated.
7.2.3.2. Stepwise Regression Output Options
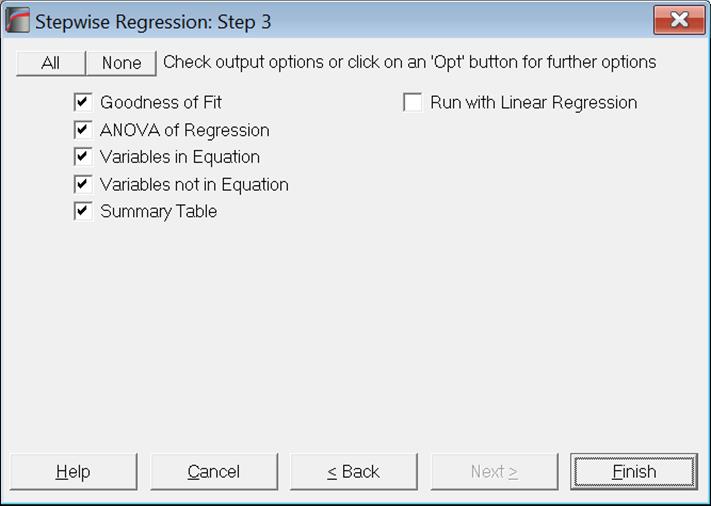
The full output can be substantial, as a large amount of statistics are reported for each step. These include the standard error, multiple correlation, R-squared, adjusted R-squared, change in R-squared, Analysis of Variance. The regression coefficient, its standard error, t-statistic, its tail probability and the calculated F-to-remove value are displayed for each independent variable. Partial correlation, Tolerance and F-to-enter values of variables which are not in the equation are also displayed.
At the end of the selection process, a summary table gives the multiple correlation, R-squared and F-statistic for each step.
Run with Linear Regression: Although Stepwise Regression is a powerful procedure for selecting variables to be included in the model, its output options are not as extensive as in Linear Regression. As of this version of UNISTAT we introduce this output option which will give access to the full list of output options of Linear Regression for the final configuration of selected variables.
The program does not stop to ask which Linear Regression output options should be displayed. Instead, it uses the current selections of Linear Regression. In order to select the desired output options, you can click on the [Last Dialogue] button (the button with the circular arrow in UNISTAT menus) to obtain the Linear Regression Output Options Dialogue
It is important to understand how missing values are handled here. Stepwise Regression omits missing variables listwise for all original variables selected, including those which have been omitted subsequently. Here, Linear Regression will also omit missing cases according to the original variables selected for Stepwise Regression, not for only those carried over to Linear Regression. Also, as usual, if for a case only the dependent variable is missing, but no independent variables are missing, the fitted Y value for that case will be predicted.
7.2.3.3. Stepwise Regression Example
Example 20.1e on p. 436 from Zar, J. H. (2010).
Open REGRESS, select Statistics 1 → Regression Analysis → Stepwise Regression and select temperature, cm, mm and min (C1 to C4) as [Variable]s and ml (C5) as [Dependent]. Select Backward Selection and accept the Tolerance levels given in the next dialogue to obtain the following output:
Stepwise Regression
Dependent Variable: ml
Valid Number of Cases: 33, 0 Omitted
Backward Selection
Tolerance: 0.001
F-to-Enter: 3.8416 (5.0%)
F-to-Remove: 2.7056 (10.0%)
All uncorrelated variables entered
|
Standard Error |
Multiple Correlation |
R-squared |
Adjusted R-squared |
Change in R-squared |
|
0.4238 |
0.8117 |
0.6589 |
0.6102 |
0.6589 |
|
Due To |
Sum of Squares |
DoF |
Mean Square |
F-Stat |
Prob |
|
Regression |
9.717 |
4 |
2.429 |
13.524 |
0.0000 |
|
Error |
5.030 |
28 |
0.180 |
|
|
|
Variables in Equation |
Coefficient |
Std Error |
t-Statistic |
Prob |
F-to-Remove |
|
Constant |
2.9583 |
|
|
|
|
|
Temperature |
-0.1293 |
0.0213 |
-6.0751 |
0.0000 |
36.9063 |
|
cm |
-0.0188 |
0.0563 |
-0.3338 |
0.7410 |
0.1114 |
|
mm |
-0.0462 |
0.2073 |
-0.2230 |
0.8252 |
0.0497 |
|
min |
0.2088 |
0.0670 |
3.1141 |
0.0042 |
9.6979 |
Step 1: Variable Removed: mm
|
Standard Error |
Multiple Correlation |
R-squared |
Adjusted R-squared |
Change in R-squared |
|
0.4168 |
0.8114 |
0.6583 |
0.6230 |
-0.0006 |
|
Due To |
Sum of Squares |
DoF |
Mean Square |
F-Stat |
Prob |
|
Regression |
9.708 |
3 |
3.236 |
18.625 |
0.0000 |
|
Error |
5.039 |
29 |
0.174 |
|
|
|
Variables in Equation |
Coefficient |
Std Error |
t-Statistic |
Prob |
F-to-Remove |
|
Constant |
2.6725 |
|
|
|
|
|
Temperature |
-0.1305 |
0.0203 |
-6.4232 |
0.0000 |
41.2572 |
|
cm |
-0.0154 |
0.0533 |
-0.2892 |
0.7745 |
0.0837 |
|
min |
0.2045 |
0.0632 |
3.2356 |
0.0030 |
10.4694 |
|
Variables not in Equation |
Partial Corr |
Tolerance |
F-to-Enter |
|
mm |
-0.0421 |
0.8518 |
0.0497 |
Step 2: Variable Removed: cm
|
Standard Error |
Multiple Correlation |
R-squared |
Adjusted R-squared |
Change in R-squared |
|
0.4104 |
0.8108 |
0.6573 |
0.6345 |
-0.0010 |
|
Due To |
Sum of Squares |
DoF |
Mean Square |
F-Stat |
Prob |
|
Regression |
9.694 |
2 |
4.847 |
28.775 |
0.0000 |
|
Error |
5.053 |
30 |
0.168 |
|
|
|
Variables in Equation |
Coefficient |
Std Error |
t-Statistic |
Prob |
F-to-Remove |
|
Constant |
2.5520 |
|
|
|
|
|
Temperature |
-0.1324 |
0.0189 |
-6.9993 |
0.0000 |
48.9907 |
|
min |
0.2013 |
0.0613 |
3.2850 |
0.0026 |
10.7910 |
|
Variables not in Equation |
Partial Corr |
Tolerance |
F-to-Enter |
|
mm |
-0.0261 |
0.9176 |
0.0198 |
|
cm |
-0.0536 |
0.8652 |
0.0837 |
Summary Table
Dependent Variable: ml
|
Step |
In/Out |
Variable |
Multiple Corr |
R-squared |
F-Stat |
Prob |
|
1 |
Out |
mm |
0.8114 |
0.6583 |
18.6251 |
0.0000 |
|
2 |
Out |
cm |
0.8108 |
0.6573 |
28.7748 |
0.0000 |