5.1.1. Summary Statistics
This procedure is also known as the Code Book procedure. Multisample data can be entered either in the form of multiple columns or data columns classified by factor columns (see 5.0.1. Multisample Data Types). If at least one factor column is selected, then a further dialogue will pop up asking for the combination of factor levels to be included.
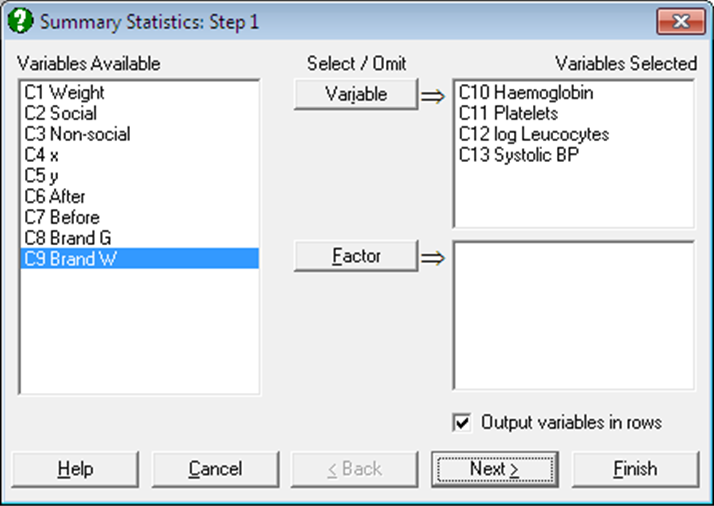
The Output variables in rows check box allows you to transpose the output matrix. This will be useful when you wish to use the output from this procedure (such as means and standard errors) for further analysis in other procedures.
Most of the statistics reported here are similar to those in the Sample Statistics procedure. The current procedure should be preferred if the data is broken down by one or more factor columns, whereas Sample Statistics should be preferred if the data has weights, frequency counts or if it is grouped.
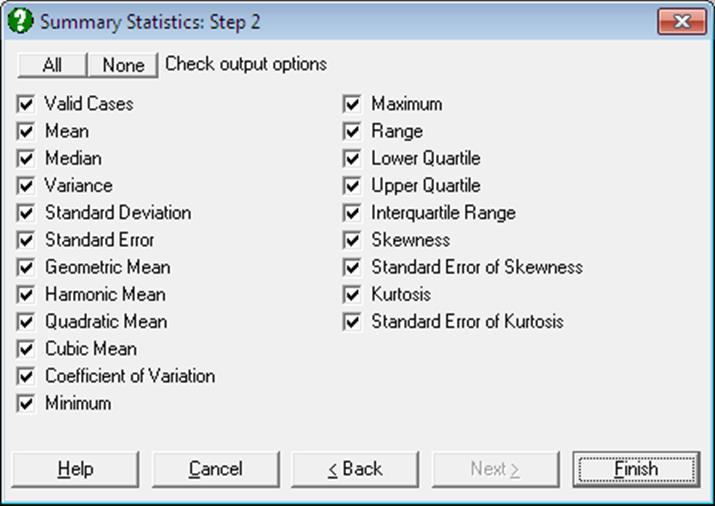
An Output Options Dialogue allows for including some or all available statistics.
Valid Cases: This is the number of cases in the sample, excluding any missing values.
Mean:
![]()
Median: The method used in computing the median is indicated in the header. This can be one of the six methods described in section 5.1.3.1. Quantile Methods.
Variance:
![]()
Standard Deviation:
![]()
Standard Error:
![]()
Geometric Mean:
![]()
Harmonic Mean:
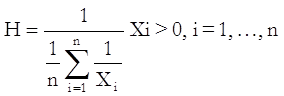
The following relationship should hold if Xi > 0, i = 1, …, n:
![]()
Quadratic Mean (Root mean square):
![]()
Cubic Mean:
![]()
Coefficient of Variation:
![]()
Minimum: Smallest observed value in data.
Maximum: Largest observed value in data.
Range: Difference between maximum and minimum values.
Lower Quartile: As in median above, but for the 25% quantile.
Upper Quartile: As in median above, but for the 75% quantile.
Interquartile Range: Difference between upper and lower quartiles.
Skewness: This should not be confused with the moment coefficient of skewness which is covered under section 5.1.4. Sample Statistics.
![]()
where mj is the jth moment about the mean (see Bliss 1967, p. 144):
![]()
Standard Error of Skewness:
![]()
Kurtosis: This should not be confused with the moment coefficient of kurtosis which is covered under section 5.1.4. Sample Statistics.
![]()
Standard Error of Kurtosis:
![]()
Example 1: Variables in columns of output table
Open PARTEST and select Statistics 1 → Descriptive Statistics → Summary Statistics. Select Haemoglobin, Platelets, log Leucocytes, and Systolic BP (C10 to C13) as [Variable]s, leave the Output variables in rows box unchecked and click [Next]. From the Output Options Dialogue select all output options and click [Finish].
Summary Statistics
Quantile Method: Simple Average
|
|
Haemoglobin |
Platelets |
log Leucocytes |
Systolic BP |
|
Valid Cases |
10.0000 |
10.0000 |
10.0000 |
10.0000 |
|
Mean |
-0.5300 |
-0.0300 |
-0.5900 |
3.1000 |
|
Median |
-0.6000 |
0.1000 |
-0.6500 |
2.0000 |
|
Variance |
2.1401 |
1.4868 |
2.4099 |
37.8778 |
|
Standard Deviation |
1.4629 |
1.2193 |
1.5524 |
6.1545 |
|
Standard Error |
0.4626 |
0.3856 |
0.4909 |
1.9462 |
|
Geometric Mean |
* |
* |
* |
* |
|
Harmonic Mean |
* |
* |
* |
* |
|
Quadratic Mean |
1.4856 |
1.1572 |
1.5865 |
6.6106 |
|
Cubic Mean |
-1.2371 |
-0.8205 |
-1.6133 |
7.4680 |
|
Coefficient of Variation |
-2.7602 |
-40.6445 |
-2.6312 |
1.9853 |
|
Minimum |
-2.4000 |
-2.2000 |
-3.2000 |
-6.0000 |
|
Maximum |
2.3000 |
1.9000 |
1.7000 |
14.0000 |
|
Range |
4.7000 |
4.1000 |
4.9000 |
20.0000 |
|
Lower Quartile |
-1.5000 |
-1.0000 |
-1.6000 |
-2.0000 |
|
Upper Quartile |
0.0000 |
0.6000 |
0.9000 |
8.0000 |
|
Interquartile Range |
1.5000 |
1.6000 |
2.5000 |
10.0000 |
|
Skewness |
0.5846 |
-0.3308 |
-0.0573 |
0.4151 |
|
Standard Error of Skewness |
0.6870 |
0.6870 |
0.6870 |
0.6870 |
|
Kurtosis |
0.0911 |
-0.0998 |
-0.7446 |
-0.4940 |
|
Standard Error of Kurtosis |
1.3342 |
1.3342 |
1.3342 |
1.3342 |
Example 2: Variables in rows of output table
Open PARTEST and select Statistics 1 → Descriptive Statistics → Summary Statistics. Select Haemoglobin, Platelets, log Leucocytes, and Systolic BP (C10 to C13) as [Variable]s, this time check the Output variables in rows box and click [Next]. From the Output Options Dialogue select the following options only and click [Finish].
Summary Statistics
|
|
Valid Cases |
Mean |
Standard Deviation |
Standard Error |
|
Haemoglobin |
10 |
-0.5300 |
1.4629 |
0.4626 |
|
Platelets |
10 |
-0.0300 |
1.2193 |
0.3856 |
|
log Leucocytes |
10 |
-0.5900 |
1.5524 |
0.4909 |
|
Systolic BP |
10 |
3.1000 |
6.1545 |
1.9462 |
Example 3: Variables in columns of output table, one table for each factor level
Open ANOVA and select Statistics 1 → Descriptive Statistics → Summary Statistics. Select AUC (C20) as [Variable] and Treatment (S19) as [Factor], uncheck the Output variables in rows box and click [Next]. On the next dialogue, leave the Run a separate analysis for each option selected box checked and from the Output Options Dialogue select the following options only and click [Finish].
Summary Statistics
Subsample selected by: Treatment = A
|
|
AUC |
|
Valid Cases |
12.0000 |
|
Mean |
209.4167 |
|
Geometric Mean |
199.8379 |
|
Harmonic Mean |
189.4269 |
|
Quadratic Mean |
218.0193 |
|
Cubic Mean |
225.6315 |
Subsample selected by: Treatment = B
|
|
AUC |
|
Valid Cases |
12.0000 |
|
Mean |
167.1667 |
|
Geometric Mean |
160.4173 |
|
Harmonic Mean |
152.6247 |
|
Quadratic Mean |
172.9480 |
|
Cubic Mean |
177.9293 |
Example 4: Factor levels in columns of output table, one table for each variable
Continuing from Example 3 above, click on the [Last Procedure Dialogue] button and go back to the Variable Selection Dialogue. Select AUC and Subject (C17 – C20) as [Variable]s and Sequence and Treatment and (S18 – S19) as [Factor]s, on the next dialogue uncheck the Run a separate analysis for each option selected box and click [Finish].
Summary Statistics
Data variable: AUC
Subsample selected by: Sequence x Treatment
|
|
AB x A |
AB x B |
BA x A |
BA x B |
|
Valid Cases |
6.0000 |
6.0000 |
6.0000 |
6.0000 |
|
Mean |
247.0000 |
157.3333 |
171.8333 |
177.0000 |
|
Geometric Mean |
241.0556 |
147.1371 |
165.6679 |
174.8962 |
|
Harmonic Mean |
234.7181 |
136.7044 |
158.7873 |
172.7419 |
|
Quadratic Mean |
252.3483 |
166.6363 |
177.1586 |
179.0372 |
|
Cubic Mean |
257.0111 |
174.7520 |
181.6798 |
180.9970 |
Data variable: Subject
Subsample selected by: Sequence x Treatment
|
|
AB x A |
AB x B |
BA x A |
BA x B |
|
Valid Cases |
6.0000 |
6.0000 |
6.0000 |
6.0000 |
|
Mean |
6.0000 |
6.0000 |
7.0000 |
7.0000 |
|
Geometric Mean |
4.5808 |
4.5808 |
6.1063 |
6.1063 |
|
Harmonic Mean |
3.1297 |
3.1297 |
5.0585 |
5.0585 |
|
Quadratic Mean |
7.0238 |
7.0238 |
7.6811 |
7.6811 |
|
Cubic Mean |
7.7250 |
7.7250 |
8.2081 |
8.2081 |