5.1.2. Confidence Intervals
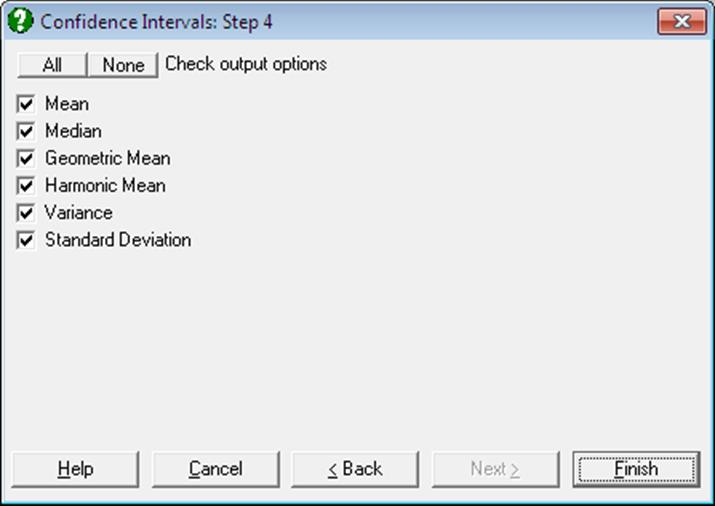
Confidence intervals for mean, median, geometric and harmonic means (t- or Z-intervals) and intervals for variance and standard deviation can be computed. Data input is in multisample format (see 5.0.1. Multisample Data Types).
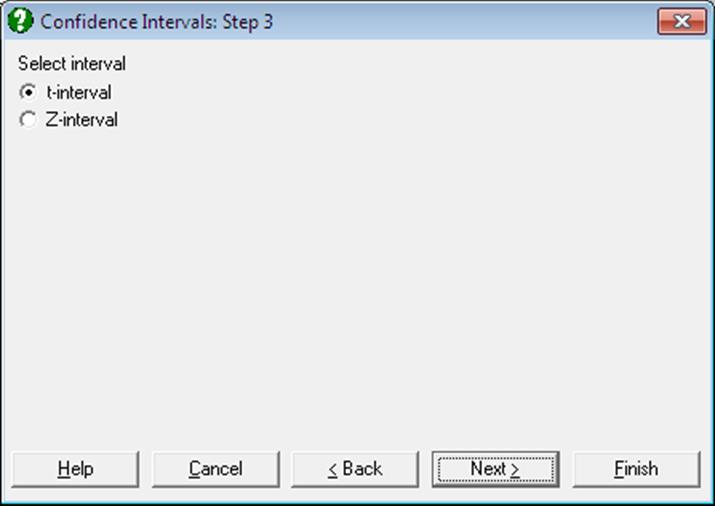
By default, intervals for means are based on the
t-distribution with a critical value of ![]() .
It is possible to calculate intervals using the standard normal distribution with
a critical value of
.
It is possible to calculate intervals using the standard normal distribution with
a critical value of ![]() . The confidence
level 1 – α can be defined in Variable Selection
Dialogue.
. The confidence
level 1 – α can be defined in Variable Selection
Dialogue.
Mean:
![]()
![]()
Median: The methods used in computing the median and its confidence limits are reported in the header. These methods can be changed using the dialogues of the Quantiles (Percentiles) procedure (see sections 5.1.3.1. Quantile Methods and 5.1.3.2. Quantile Interval Methods).
Geometric Mean: Assuming Ln(Xi) i = 1,…, n are normally distributed, the limits are defined as:
![]()
![]()
where G is the geometric mean and the term aG (which is not the standard error of geometric mean) is defined as:
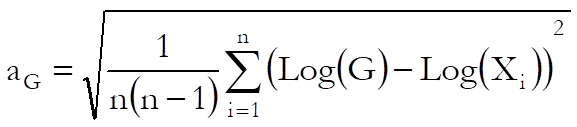
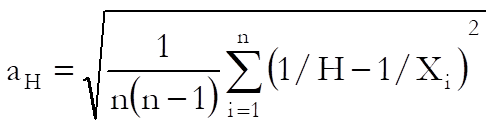
Harmonic Mean: Assuming 1/Xi i = 1,…, n are normally distributed, the confidence interval is:
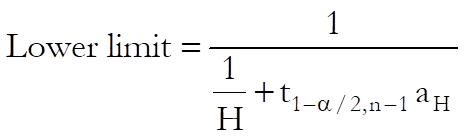

where H is the harmonic mean and the term aH (which is not the standard error of harmonic mean) is defined as:
Variance: The 100(1 – α)% confidence interval for the variance is constructed using the chi-square distribution with n – 1 degrees of freedom:
![]()
![]()
where s2 is the sample variance.
Standard Deviation: The lower and upper limits are the square roots of corresponding limits for variance.
Example
Open ANOVA and select Statistics 1 → Descriptive Statistics → Confidence Intervals and from the Variable Selection Dialogue select AUC (C20) as [Variable] and Treatment (S19) as [Factor] and click [Finish].
Confidence Intervals
Data variable: AUC
Subsample selected by: Treatment = A
Number of Cases: 12
|
|
Value |
Lower 95% |
Upper 95% |
|
* Mean |
209.4167 |
169.1754 |
249.6580 |
|
** Median |
200.5000 |
154.0000 |
290.0000 |
|
* Geometric Mean |
199.8379 |
161.9368 |
246.6098 |
|
* Harmonic Mean |
189.4269 |
153.3584 |
247.6786 |
|
Variance |
4011.3561 |
2012.9935 |
11563.8961 |
|
Standard Deviation |
63.3353 |
44.8664 |
107.5356 |
* t-interval
** Quantile Method: Simple Average, Interval Method: Normal Approximation
Data variable: AUC
Subsample selected by: Treatment = B
Number of Cases: 12
|
|
Value |
Lower 95% |
Upper 95% |
|
* Mean |
167.1667 |
137.7396 |
196.5937 |
|
** Median |
165.5000 |
133.0000 |
210.0000 |
|
* Geometric Mean |
160.4173 |
131.3584 |
195.9047 |
|
* Harmonic Mean |
152.6247 |
123.7428 |
199.0937 |
|
Variance |
2145.0606 |
1076.4422 |
6183.7587 |
|
Standard Deviation |
46.3148 |
32.8092 |
78.6369 |
* t-interval
** Quantile Method: Simple Average, Interval Method: Normal Approximation
Go back to the Variable Selection Dialogue omit Treatment (S19) from the [Factor] list and select the Z interval option on the next dialogue.
Confidence Intervals
Data variable: AUC
Number of Cases: 24
|
|
Value |
Lower 95% |
Upper 95% |
|
* Mean |
188.2917 |
164.9290 |
211.6543 |
|
** Median |
187.5000 |
154.0000 |
220.0000 |
|
* Geometric Mean |
179.0460 |
156.5802 |
204.7352 |
|
* Harmonic Mean |
169.0460 |
146.8020 |
199.2349 |
|
Variance |
3410.0417 |
2059.8730 |
6710.0662 |
|
Standard Deviation |
58.3956 |
45.3858 |
81.9150 |
* Z-interval
** Quantile Method: Simple Average, Interval Method: Normal Approximation