5.1.3. Quantiles (Percentiles)
Quantiles and their confidence limits can be estimated for multiple samples (see 5.0.1. Multisample Data Types). A dialogue allows specifying up to nine quantiles. A quantile will be computed for any entry as long as:
0 < q < 1
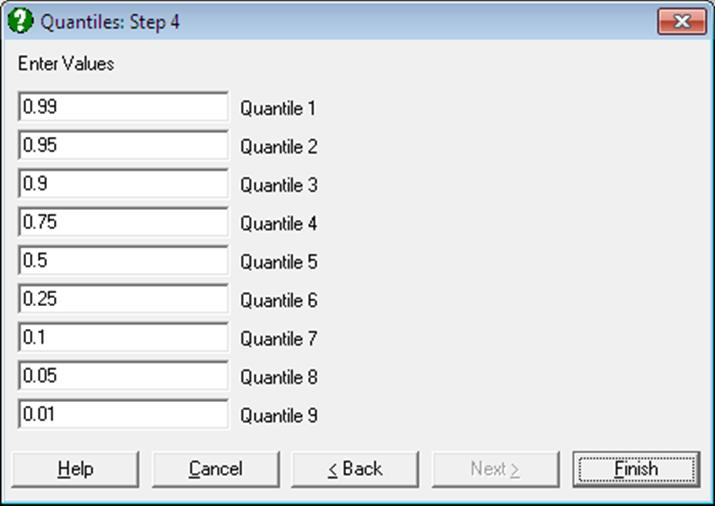
All other values will be treated as missing and they will not be shown in the output. For instance, if you wish to display only the median and quartiles in the output, enter 0.25, 0.5 and 0.75 in the first three boxes and enter 0 in the remaining. The output will have three rows only. Values entered in this dialogue will be stored by the program.
5.1.3.1. Quantile Methods
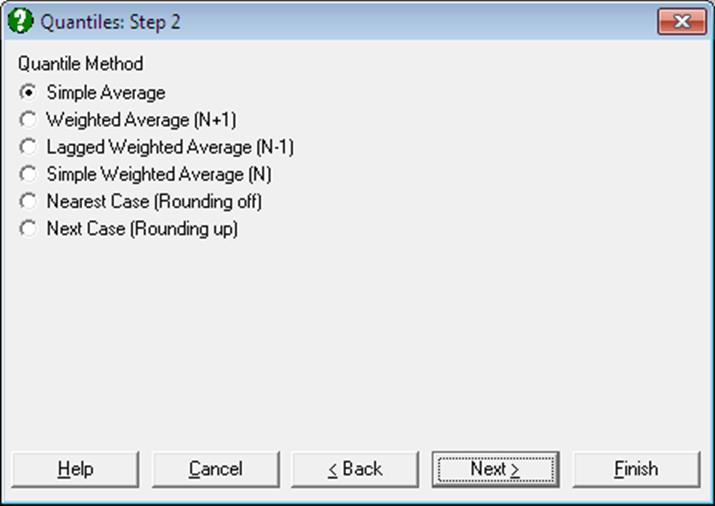
It is possible to compute quantiles according to six alternative definitions. The common parameters used in these definitions are as follows:
n: Valid number of cases
q: Quantile / 100 (0 < q < 1)
j: Integer part of nq
g: Fractional part of nq
Simple Average (UNISTAT default):
![]()
if g = 0 then ![]()
if g > 0 then ![]()
Weighted Average (N + 1):
![]()
![]()
Lagged Weighted Average (N – 1):
![]()
![]()
Simple Weighted Average (N):
![]()
![]()
Nearest Case (Rounding-off):
![]()
![]()
Next Case (Rounding-up):
![]()
if g = 0 then ![]()
if g > 0 then ![]()
5.1.3.2. Quantile Interval Methods
A further dialogue allows for selecting one of the following confidence interval methods:
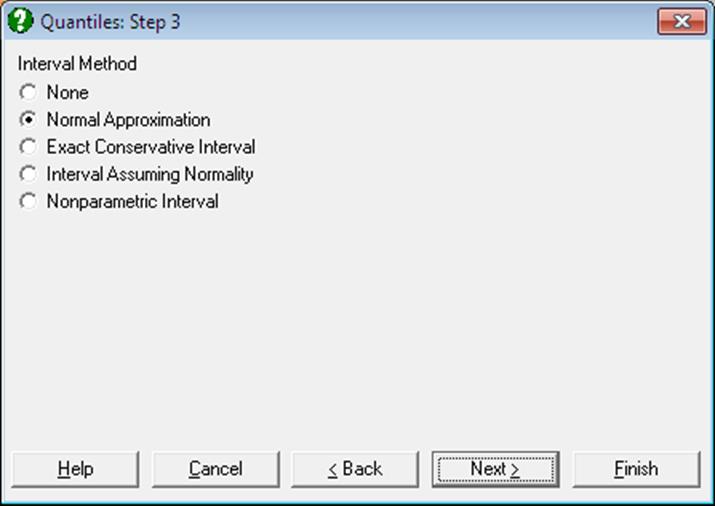
None: Quantiles are displayed without their confidence limits.
Normal Approximation: Let l and u be the ranks of the lower and upper limits respectively. The approximate 100(1 – α)% confidence interval for the Qth quantile is constructed using the normal distribution:
![]()
![]()
where:
q = Q / 100 (0 < q < 1)
The lower and upper limits of the confidence interval are the lth and uth observations of the data sorted in increasing order. For small data sets a closed interval may not exist. See Gardner & Altman (2000), p. 39.
Exact Conservative Interval: This is calculated using the binomial distribution, by finding the rank of the two observations, one corresponding to the largest cumulative probability under:
![]()
and the other to the smallest over:
![]()
using the binomial distribution with a probability equal to q. The exact conservative interval is pu – pl. See Gardner & Altman (2000), p. 39.
Interval Assuming Normality: Assuming the variable is normally distributed, confidence limits for the Qth quantile are based on the noncentral t-distribution:
![]()
![]()
See Hahn, G. J. and Meeker, W. Q. (1991), p. 56.
Nonparametric Interval: The distribution-free confidence limits for the Qth quantile should conform to the following set of constrains:
· l and u are symmetric (or nearly symmetric) around p(n + 1),
· l and u are as near to p(n + 1) as possible,
· the coverage probability is as small as possible over 1 – α, or
· B(u – 1; n, p) – B(l – 1; n, p) ≥ 1 – α,
· 0 < l < u ≤ n,
· 0 < p < 1.
where B is the cumulative binomial probability:
![]()
and nearly symmetric means that the difference between distances of l and u from q(n + 1) can only be ±1 position at the most. The left hand side of the first inequality is called the coverage probability. See Hahn, G. J. and Meeker, W. Q. (1991), p. 83.
5.1.3.3. Quantiles in Other Procedures
Apart from the dedicated Quantiles (Percentiles) procedure, UNISTAT also reports quantiles (or percentiles) in some other procedures. The quantile method and the quantile interval method selected in this procedure will also be valid in the following procedures, with a few exceptions.
Summary Statistics: Median and quartiles are reported (see 5.1.1. Summary Statistics).
Confidence Intervals: Median and its confidence limits are reported (see 5.1.2. Confidence Intervals).
Sample Statistics: Median and quartiles are reported. The quantile method selected in the current procedure will be valid only for the first data option Select Multiple Columns. If data has frequency counts or it is grouped (i.e. data options 2 and 3), then quantiles are computed with their own dedicated algorithms corresponding to these data types (see 5.1.4. Sample Statistics).
Histogram: Median and quartiles are drawn on the graph, if selected (see 5.3.3. Histogram).
3D Histogram: Median and quartiles are drawn on the graph, if selected (see 5.3.4. 3D Histogram).
Box-Whisker, Dot and Bar Plots: In box plot median and quartiles and in dot plot median, quartiles and user-defined percentiles can be drawn on the graph. The quantile method selected in the current procedure will be valid for all these quantiles (see 5.3.1. Box-Whisker, Dot and Bar Plots).
5.1.3.4. Quantiles Example
Open ANOVA and select Statistics 1 → Descriptive Statistics → Quantiles (Percentiles). Select AUC (C20) as [Variable] and Treatment (S19) as [Factor]. In the next two dialogues select quantile method as Simple Average and interval method Nonparametric Interval. In the last dialogue accept the quantiles given and click [Finish].
Quantiles
Data variable: AUC
Subsample selected by: Treatment = A
Number of Cases: 12
Quantile Method: Simple Average
Interval Method: Nonparametric Interval
|
Quantile |
Value |
Lower 95% |
Upper 95% |
Lower rank |
Upper rank |
Coverage probability |
|
99% |
294.0000 |
290.0000 |
294.0000 |
10 |
12 |
0.1134 |
|
95% |
294.0000 |
290.0000 |
294.0000 |
10 |
12 |
0.4401 |
|
90% |
293.0000 |
290.0000 |
294.0000 |
10 |
12 |
0.6067 |
|
75% |
270.0000 |
200.0000 |
294.0000 |
6 |
12 |
0.9541 |
|
50% |
200.5000 |
154.0000 |
290.0000 |
3 |
10 |
0.9614 |
|
25% |
161.0000 |
97.0000 |
201.0000 |
1 |
7 |
0.9541 |
|
10% |
151.0000 |
97.0000 |
154.0000 |
1 |
3 |
0.6067 |
|
5% |
97.0000 |
97.0000 |
154.0000 |
1 |
3 |
0.4401 |
|
1% |
97.0000 |
97.0000 |
154.0000 |
1 |
3 |
0.1134 |
Data variable: AUC
Subsample selected by: Treatment = B
Number of Cases: 12
Quantile Method: Simple Average
Interval Method: Nonparametric Interval
|
Quantile |
Value |
Lower 95% |
Upper 95% |
Lower rank |
Upper rank |
Coverage probability |
|
99% |
240.0000 |
210.0000 |
240.0000 |
10 |
12 |
0.1134 |
|
95% |
240.0000 |
210.0000 |
240.0000 |
10 |
12 |
0.4401 |
|
90% |
220.0000 |
210.0000 |
240.0000 |
10 |
12 |
0.6067 |
|
75% |
200.0000 |
163.0000 |
240.0000 |
6 |
12 |
0.9541 |
|
50% |
165.5000 |
133.0000 |
210.0000 |
3 |
10 |
0.9614 |
|
25% |
136.5000 |
77.0000 |
168.0000 |
1 |
7 |
0.9541 |
|
10% |
116.0000 |
77.0000 |
133.0000 |
1 |
3 |
0.6067 |
|
5% |
77.0000 |
77.0000 |
133.0000 |
1 |
3 |
0.4401 |
|
1% |
77.0000 |
77.0000 |
133.0000 |
1 |
3 |
0.1134 |