5.3.4. 3D Histogram
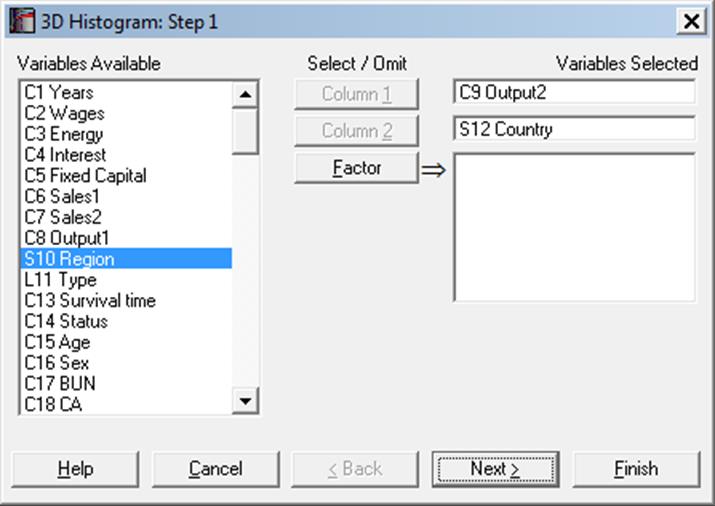
A 3D Histogram can be drawn by selecting two numeric or string variables as [Column 1] and [Column 2]. Optionally, one or more factors can be selected, in which case the program will display a list of all possible combinations of factor levels. The unchecked levels will be excluded from the plot. If Run a separate analysis for each option selected is checked, a separate output will be generated for each factor level. Otherwise, one histogram is drawn with the included factor levels.
Observations falling within each class of X-variable are further classified according to classes of the Y-variable (or vice versa). Mean, median, mode and quartiles can be displayed and class intervals edited for axes displaying numeric variables.
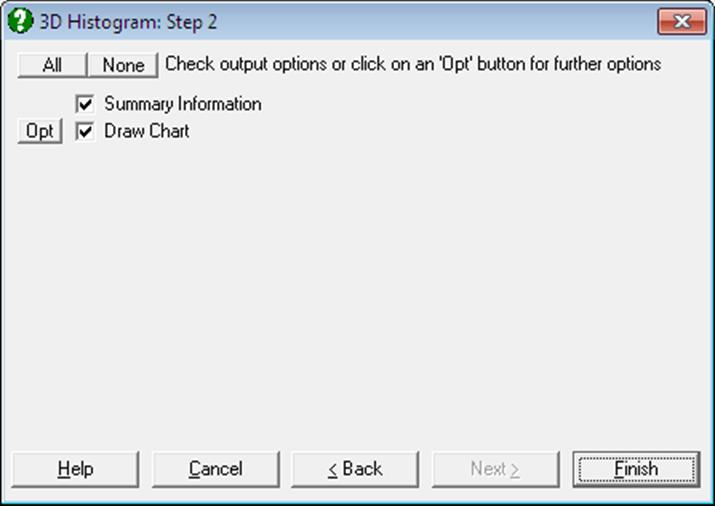
The Summary Information option will produce two tables for frequencies and statistics. As in other output options, when you click on the [Finish] button, the summary information and the histogram will be sent to the Output Medium with default options. If you want to edit the properties of the histogram, then you can send it to Graphics Editor by clicking on the [Opt] button situated to the left of the Draw Chart check box.
The mode displayed on each axis is the mode for that particular variable, but not for the 3D distribution of frequencies. Therefore, the highest bar on the graph should not necessarily correspond to any mode values displayed.
The Edit dialogues for this procedure are similar to those of 2D Histogram procedure, except there is no possibility here to fit Distribution Functions on 3D Histograms.
Example
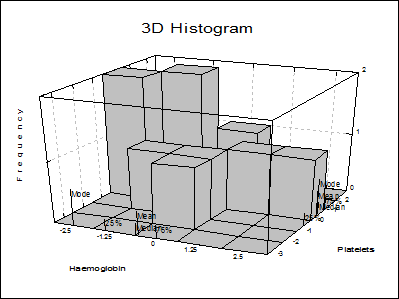
Open PARTESTS and select Graph → Descriptive Plots → 3D Histogram. Select Haemoglobin (C10) as [Column 1] and Platelets (C11) as [Column 2]. In the following output titles of the graph have been edited manually.
3D Histogram
Frequency Table
|
Platelets \ Haemoglobin |
-2.5 |
-1.25 |
0 |
1.25 |
2.5 |
Total |
|
-3 |
0 |
0 |
0 |
0 |
0 |
0 |
|
-2 |
0 |
0 |
1 |
0 |
0 |
1 |
|
-1 |
0 |
1 |
1 |
0 |
0 |
2 |
|
0 |
2 |
0 |
0 |
1 |
1 |
4 |
|
1 |
0 |
2 |
0 |
0 |
0 |
2 |
|
2 |
0 |
0 |
1 |
0 |
0 |
1 |
|
Total |
2 |
3 |
3 |
1 |
1 |
10 |
Descriptive Statistics
|
|
Haemoglobin |
Platelets |
|
Mean |
-0.5300 |
-0.0300 |
|
Median |
-0.6000 |
0.1000 |
|
Mode |
-2.5000 |
0.0000 |
|
Lower Quartile |
-1.5000 |
-1.0000 |
|
Upper Quartile |
0.0000 |
0.6000 |