6.1.2. Equivalence Test for Means
t-tests are used to decide whether two means are significantly different from each other. If you wish to find out whether two means cannot be said to be different within predefined boundaries (lower and upper equivalence bounds), use this test. The null hypothesis tested is that the two means are not equivalent, i.e. difference between them is less than the lower equivalence bound or greater than the upper equivalence bound. If the alternative hypothesis is true, namely that the difference is between the two equivalence bounds, then the two means are said to be equivalent.
When the lower and upper equivalence bounds are 0, this test is equivalent to the standard t-test, except that here the confidence limits are reported at 1 – 2α level, rather than the usual 1 – α.
This is the parametric version of equivalence test for binomial proportions (see 6.4.3.5. Equivalence Test for Binomial Proportion).
Example
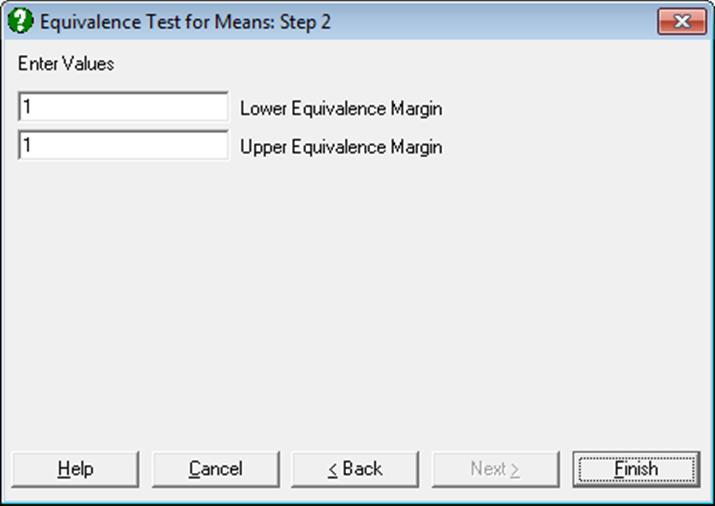
Open PARTESTS and select Statistics 1 → Parametric Tests → Equivalence Test for Means and select Before and After (C6 and C7) as [Variable]s and check all output options to obtain the following results:
Equivalence Test for Means
For Before and After
|
Lower Equivalence Margin = |
1.0000 |
|
Lower Equivalence |
Difference |
Standard Error |
t-Statistic |
Degrees of Freedom |
|
Pooled Variance |
-6.6250 |
4.5965 |
-1.2237 |
30.0000 |
|
Separate Variance |
-6.6250 |
4.5965 |
-1.2237 |
29.7148 |
|
Lower Equivalence |
1-Tail Probability |
2-Tail Probability |
Lower 90% |
Upper 90% |
|
Pooled Variance |
0.1153 |
|
-14.4265 |
|
|
Separate Variance |
0.1153 |
|
-14.4289 |
|
|
Upper Equivalence Margin = |
1.0000 |
|
Upper Equivalence |
Difference |
Standard Error |
t-Statistic |
Degrees of Freedom |
|
Pooled Variance |
-6.6250 |
4.5965 |
-1.2237 |
30.0000 |
|
Separate Variance |
-6.6250 |
4.5965 |
-1.2237 |
29.7148 |
|
Upper Equivalence |
1-Tail Probability |
2-Tail Probability |
Lower 90% |
Upper 90% |
|
Pooled Variance |
0.1153 |
|
|
1.1765 |
|
Separate Variance |
0.1153 |
|
|
1.1789 |
|
Overall |
1-Tail Probability |
Lower 90% |
Upper 90% |
|
Pooled Variance |
0.1153 |
-14.4265 |
1.1765 |
|
Separate Variance |
0.1153 |
-14.4289 |
1.1789 |