6.6.3. Break-Down
This procedure produces a table featuring the number of cases, means and standard deviations for an unlimited number of continuous variables, broken down by an unlimited number of categorical variables. Each row of the list corresponds to a particular combination of levels of categorical variables (or factors) which can contain numeric or String Data. Factors are selected by clicking on [Factor] (see 6.0.8. R x C Tables). It is compulsory to select at least one factor column and a data variable (i.e. a continuous numeric data column) by clicking on [Variable]. A table will be displayed for each data variable, keeping the factor selections unchanged. Optionally, you can also select a column containing weights by clicking on [Weight]. In this case, all statistics displayed will be weighted by this column.
A similar analysis can be performed in the Regression and ANOVA module using the Table of Means procedure.
The program will sort each factor separately, determine the number of categories in each and then compute the number of cases, mean and standard deviation of the continuous data variable for every combination of categories.
Example
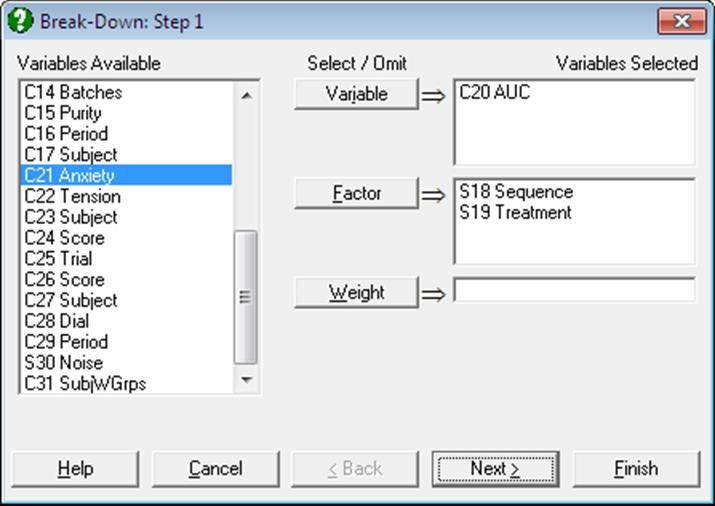
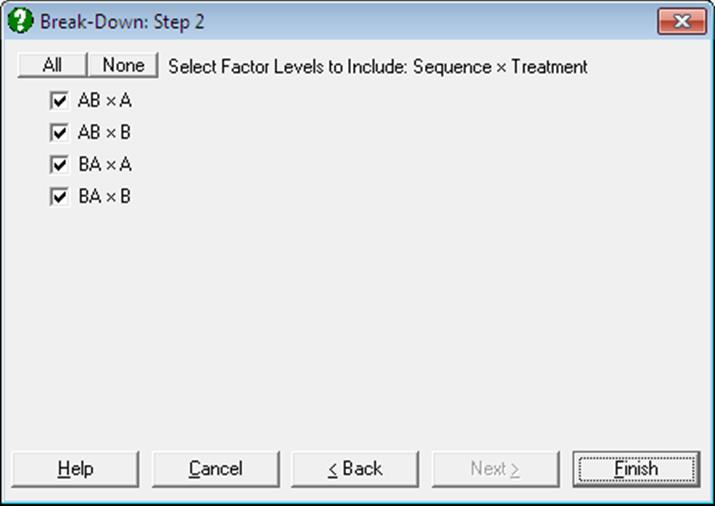
Open ANOVA and select Statistics 1 → Tables → Break-Down. Select AUC (C20) as [Variable] and Sequence (S18) and Treatment (S19) as [Factor]s.
Break-Down
Data variable: AUC
|
Sequence x Treatment |
Cases |
Mean |
Standard Deviation |
Standard Error |
|
AB x A |
6 |
247.0000 |
56.6110 |
23.1113 |
|
AB x B |
6 |
157.3333 |
60.1387 |
24.5515 |
|
BA x A |
6 |
171.8333 |
47.2246 |
19.2794 |
|
BA x B |
6 |
177.0000 |
29.5025 |
12.0444 |