7.4.1. Table of Means
The Table of Means procedure can be considered as a Break-Down analysis with interaction terms. Observations of the dependent variable which belong to every possible combination of factor levels are grouped together and the number of cases, mean, standard deviation, standard error and the lower and upper limits of the confidence interval for the mean are displayed. Unlike the Break-Down table, here factor combinations follow the sequence of ANOVA tables, that is, first one-way effects, then two-way interactions, then three-way interactions, etc.
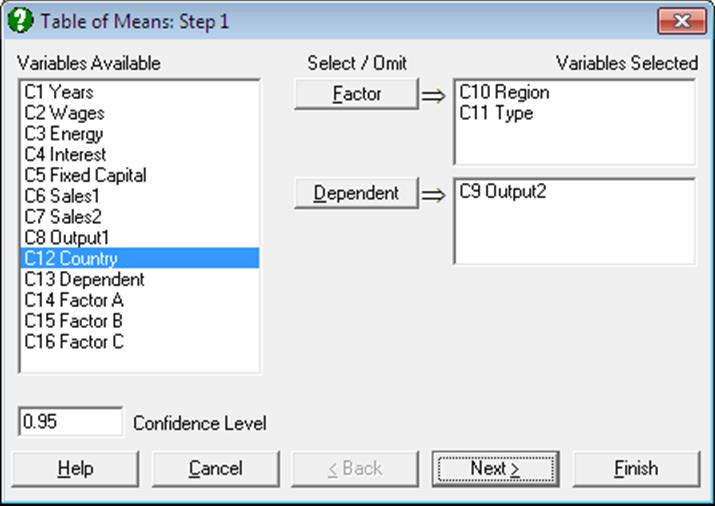
At least one factor and one data column should be selected from the Variables Available list. An unlimited number of factors can be selected in exactly the same way as for an ANOVA procedure.
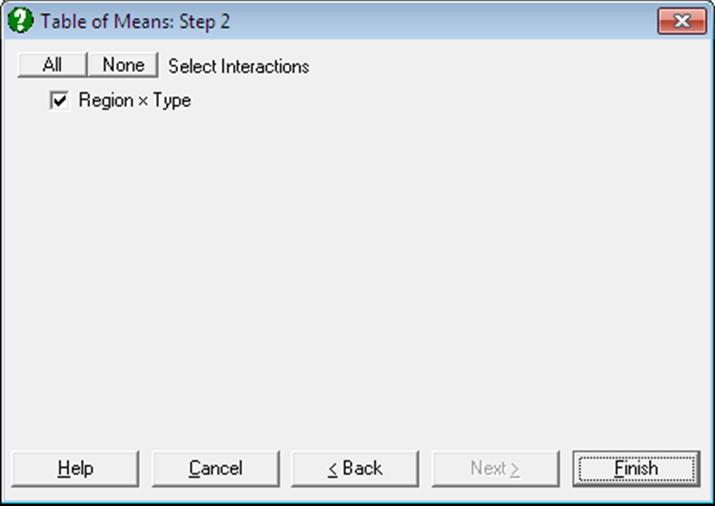
It is optional to include two-way or higher interactions within the analysis. A further dialogue allows you to include the desired interaction terms in the analysis by clicking on the corresponding check boxes.
Example
Open DEMODATA, select Statistics 1 → Tests for ANOVA → Table of Means and select Region (C10) and Type (C11) as [Factor]s and Output2 (C9) as [Dependent].
Table of Means
For Output2
|
|
Cases |
Mean |
Standard Deviation |
Standard Error |
Lower 95% |
Upper 95% |
|
whole sample |
58 |
107.4679 |
6.7398 |
0.8850 |
105.6958 |
109.2401 |
|
Region = 1 |
14 |
106.1586 |
6.9131 |
1.8476 |
102.1671 |
110.1501 |
|
2 |
26 |
107.8269 |
6.7597 |
1.3257 |
105.0966 |
110.5572 |
|
3 |
18 |
107.9678 |
6.8330 |
1.6106 |
104.5698 |
111.3658 |
|
Type = 1 |
16 |
107.0837 |
6.9366 |
1.7342 |
103.3875 |
110.7800 |
|
2 |
42 |
107.6143 |
6.7430 |
1.0405 |
105.5130 |
109.7156 |
|
Region x Type = 1 x 1 |
7 |
103.6271 |
7.7791 |
2.9402 |
96.4327 |
110.8216 |
|
1 x 2 |
7 |
108.6900 |
5.2991 |
2.0029 |
103.7892 |
113.5908 |
|
2 x 1 |
5 |
111.5200 |
1.7219 |
0.7701 |
109.3820 |
113.6580 |
|
2 x 2 |
21 |
106.9476 |
7.2320 |
1.5782 |
103.6557 |
110.2396 |
|
3 x 1 |
4 |
107.5875 |
7.3881 |
3.6940 |
95.8315 |
119.3435 |
|
3 x 2 |
14 |
108.0764 |
6.9572 |
1.8594 |
104.0594 |
112.0934 |