2.3.5. View Menu
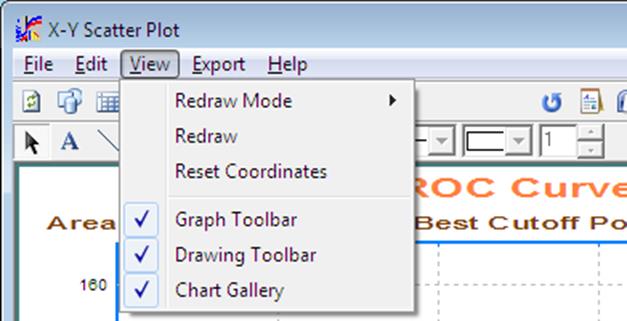
2.3.5.1. Redraw Mode
When a change is made to the graph settings from the menu bar and the dialogue exited by pressing <Enter/OK>, UNISTAT will automatically redraw the graph with the new settings. However, when editing complicated graphs with many data points, it may not be desirable for the program to redraw the image after every single edit operation. In order to switch off auto redrawing, and enable the manual redraw mode, select View → Redraw Mode. Two further options will appear; Auto and Manual. On entry, the Auto option will be checked, indicating that graphs are redrawn automatically. Click on Manual. Then to redraw the graph after editing a setting, either by pressing <Ctrl> + <R>, or by clicking on the first button on the toolbar which has a graph picture on a white background (see 2.3.5.2. Redraw).
To enable the program to redraw the graphs automatically again, select the Auto option from View → Redraw Mode.
For simple plots or charts the Auto option may be more convenient to use. However in the case of 3D surface plots or curves or surface fitting routines, or any other graphics procedure that requires intensive computing, switching to Manual is recommended.
2.3.5.2. Redraw
Redraw causes the entire graph to be redrawn. This is especially useful if the Redraw Mode is set to Manual.
2.3.5.3. Reset Coordinates
This is equivalent to selecting Edit → Options → Coordinates from the pull-down menu which will restore the default coordinates of the frame, plot area, legend and all standard text objects (main, sub and axis titles). The same effect can also be achieved by clicking on the [Reset] button on the Graphics Toolbar.
2.3.5.4. Graphics Toolbar
![]()
This will toggle the Graphics Toolbar on and off.
2.3.5.5. Drawing Toolbar
![]()
This will toggle the Drawing Toolbar on and off and is equivalent to clicking on the second button on the Graphics Toolbar.
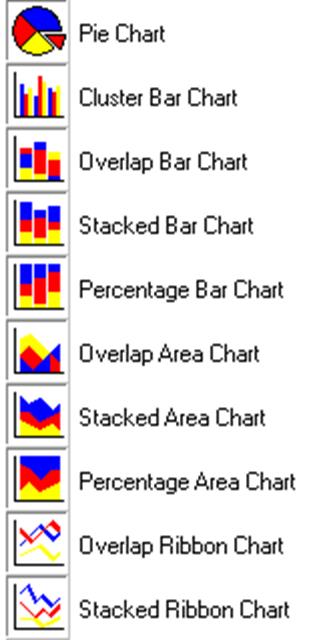
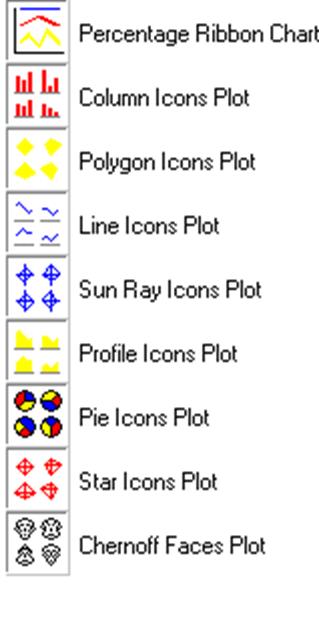
2.3.5.6. Chart Gallery
![]()
The Chart Gallery is a toolbar containing a drop-down list of graphics options. It is displayed on the top-right of the Graphics Editor window and has the following options.
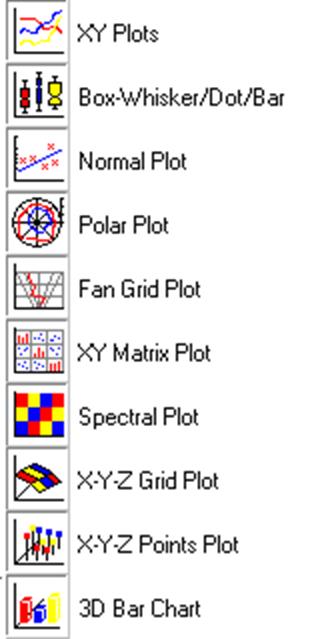
This toolbar will appear in any graphics procedure where selections are made by clicking on the [Variable] button. When a selection is made from the drop-down list, the new graph will be drawn immediately with the already selected variables, without asking for further user input.
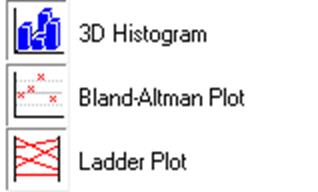
With this version of UNISTAT a new mini Chart Gallery is introduced for the three paired data procedures (3D Histogram, Bland-Altman Plot and Ladder Plot) so that each can be visualised instantly with the same data selection.