8.6. Canonical Correlations
Like the Principal Components Analysis, the Canonical Correlations procedure forms a linear combination of variables that explain most of the variation in data. However, while in Principal Components Analysis the relationships within a single set of variables are sought, in Canonical Correlations relationships between two groups of variables are analysed. Often, an analogy is drawn between Canonical Correlations and Regression Analysis. In a way, the former can be considered as a regression with multiple dependent variables and with no asymmetry between the two groups of variables.
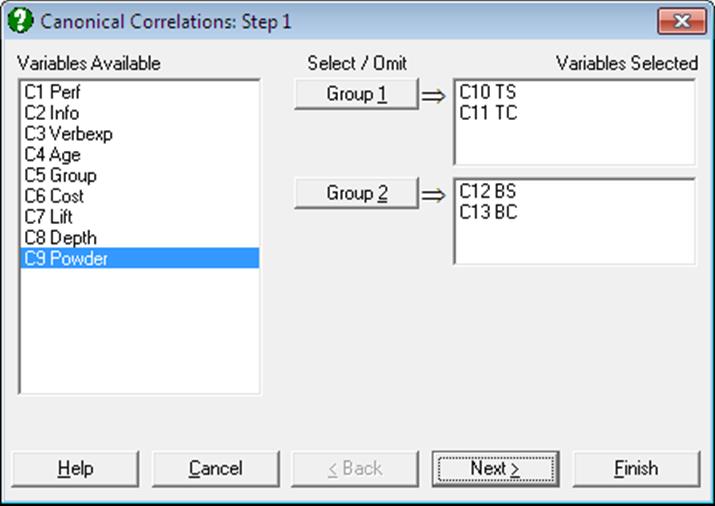
Select the data columns belonging to two groups by clicking on [Group 1] and [Group 2] from the Variable Selection Dialogue. Although the number of variables in two groups need not necessarily be the same, the number of correlations computed will be the smaller of the two group sizes.
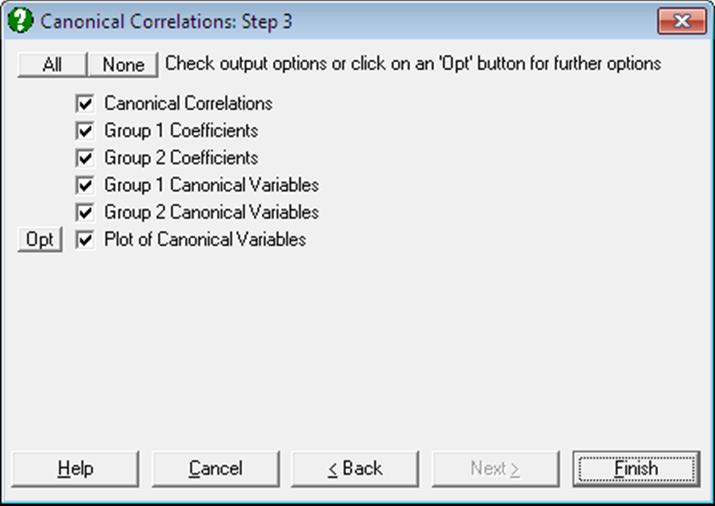
The following output options are provided.
Canonical Correlations: These are simply the square roots of eigenvalues. Wilks’ Lambda is computed as follows.
![]()
where i = 2, …, n and is chi-square distributed with (p – i)(q – i) degrees of freedom.
Transformation Coefficients: These are the multipliers transforming the original variables into two sets of linear combinations (Canonical Variables).
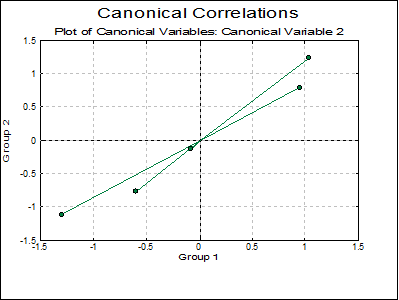
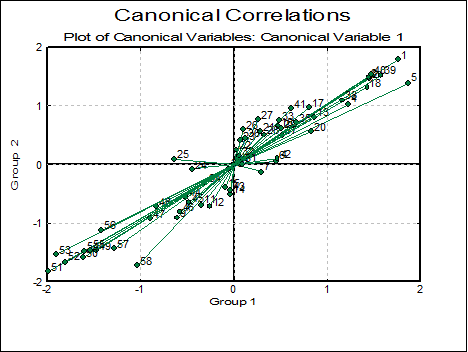
Canonical Variables: Canonical Variables are the linear combinations of the original variables in groups 1 and 2. Correlations between these variables help to determine whether groups 1 and 2 are correlated.
Example
Table 6.1 on p. 197 from Tabachnick, B. G. & L. S. Fidell (1989).
Open MULTIVAR, select Statistics 2 → Canonical Correlations and select TS and TC (C10 and C11) as [Group 1] and BS and BC (C12 and C13) as [Group 2].
Canonical Correlations
Group 1: TS, TC
Group 2: BS, BC
|
|
Eigenvalue |
Correlation |
Wilks’ lambda |
Chi-Square |
DoF |
Probability |
|
1 |
0.9982 |
0.9991 |
0.0001 |
14.6209 |
4 |
0.0056 |
|
2 |
0.9675 |
0.9836 |
0.0325 |
5.1415 |
1 |
0.0234 |
Group 1 Coefficients
|
Group 1 |
Grp1CanVarCo1 |
Grp1CanVarCo2 |
|
TS |
-0.0469 |
1.0707 |
|
TC |
1.0159 |
-0.3414 |
Group 2 Coefficients
|
Group 2 |
Grp2CanVarCo1 |
Grp2CanVarCo2 |
|
BS |
0.0529 |
1.0380 |
|
BC |
0.9843 |
-0.3338 |
Group 1 Canonical Variables
|
Group 1 |
Grp1CanVar1 |
Grp1CanVar2 |
|
1 |
1.2619 |
0.9462 |
|
2 |
0.8540 |
-1.2966 |
|
3 |
-0.4013 |
-0.0815 |
|
4 |
-0.7031 |
1.0295 |
|
5 |
-1.0114 |
-0.5976 |
Group 2 Canonical Variables
|
Group 2 |
Grp2CanVar1 |
Grp2CanVar2 |
|
1 |
1.2492 |
0.7865 |
|
2 |
0.8460 |
-1.1180 |
|
3 |
-0.3284 |
-0.1365 |
|
4 |
-0.7176 |
1.2348 |
|
5 |
-1.0492 |
-0.7669 |