5.2.3. Probabilities and Critical Values
This procedure will take as input cumulative probabilities (or critical values) and their corresponding parameter values from spreadsheet columns and output the estimated critical values (or cumulative probabilities). For a few quick calculator-type calculations, you may wish to use the Cumulative Probability or Critical Value procedures instead. Two different types of analysis can be performed depending on the type of data available.
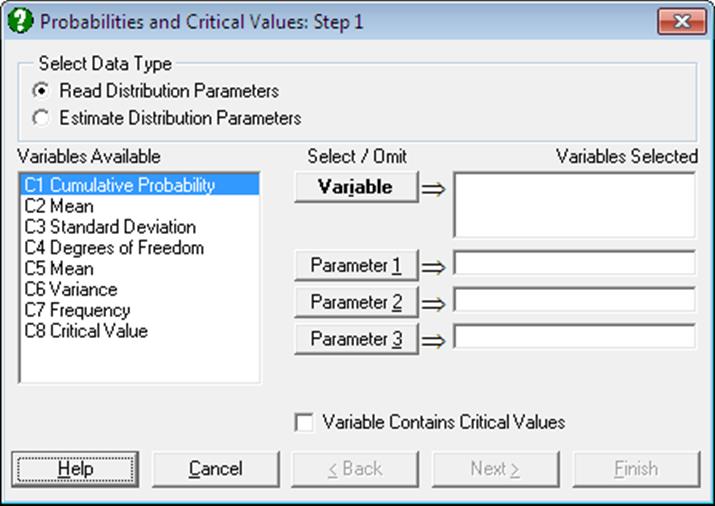
1) Read Distribution Parameters: Select one or more [Variable]s containing either cumulative probabilities or critical values. If the selected column contains critical values also check the box Variable Contains Critical Values. For probability input, this box should be unchecked. Also select the parameters required by the particular distribution you will want to use by clicking [Parameter 1], [Parameter 2] or [Parameter 3]. For instance, t-distribution requires three parameters, mean, standard deviation and degrees of freedom, so at this stage you will also need to select the three columns containing these parameters. If you are not sure about how many parameters, which parameters and in which order to select, then you can consult Appendix, where all this information is given. You can also learn the parameters required by a particular distribution by running one of Cumulative Probability or Critical Value procedures first. If the number of parameter columns selected matches the number of parameters required by a particular distribution, then the usual distribution selection dialogue pops up next. Otherwise the program displays a message and does not proceed further.
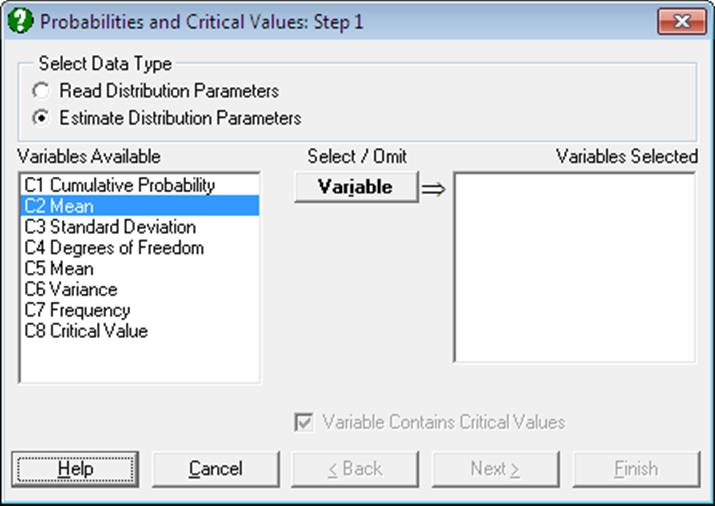
2) Estimate Distribution Parameters: If you do not know the parameter values then this option can be used to estimate them from data. In this case, only the [Variable]s containing critical values can be selected.
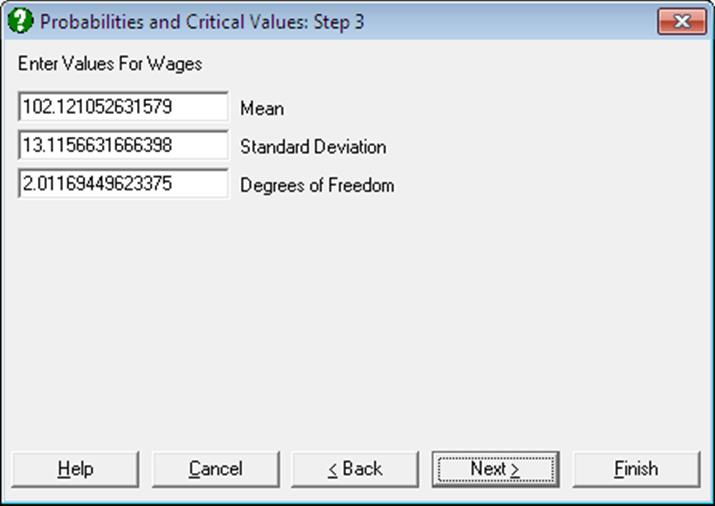
After the Distribution Functions dialogue the program will ask for the parameters of the selected distribution as in the case of single Cumulative Probability procedure. Here, however, the parameter values suggested are calculated by the program directly from the selected column, assuming that the distribution of the random variable is that given in the selected column. For instance, the suggested mean and standard deviation values for the normal distribution will be the mean and the standard deviation of the selected column. If a parameter cannot be estimated by the program then the value -99 will appear in the input field. You may override the suggested values and enter any parameter values.
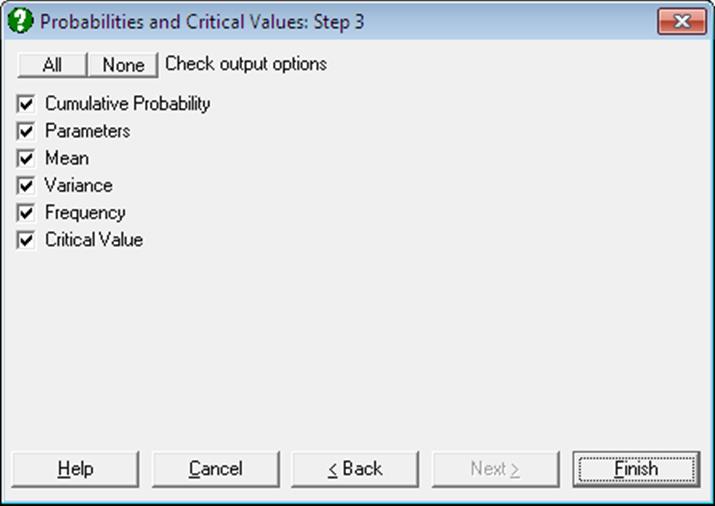
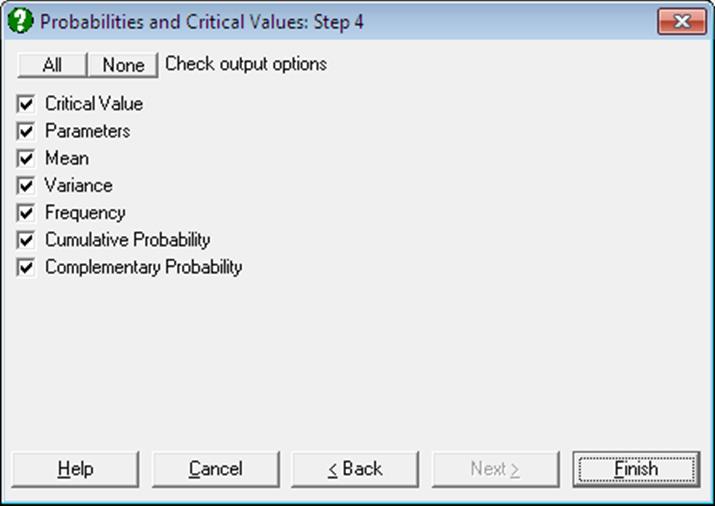
Output includes the estimates of mean, variance and the probability density. Probabilities calculated are cumulative, i.e. they give the area enclosed under the density function from negative infinity up to the critical value given in data column. If input data are critical values, then output options will include cumulative and complementary (1 – cumulative) probabilities. If input data are cumulative probabilities, then critical values will be the last output option.
Errors are handled separately for each critical value. This means that even if all values of the selected column are illegal for the selected distribution function, a table will still be displayed with all results as missing. This helps to visualise the valid range of the random variable for given parameters.
Example 1
Consider a hypothetical example where three sets of cumulative probabilities, means and standard deviations are given and we want to find their corresponding critical values. Select File → New and then enter the following data:
|
|
Prob |
Mean |
StdDev |
|
1 |
0.025 |
0 |
1 |
|
2 |
0.05 |
-2 |
2 |
|
3 |
0.1 |
1 |
0.5 |
Select Statistics 1 → Distribution Functions → Probabilities and Critical Values, the data option Read Distribution Parameters and C1 Prob as [Variable], C2 Mean as [Parameter 1] and C3 StdDev as [Parameter 2]. Leave the Variable Contains Critical Values box unchecked. Select Normal from the distribution list and check all output options to obtain the following results:
Probabilities and Critical Values
Normal Distribution
Probability: Prob
Mean: Mean
Standard Deviation: StdDev
|
|
Cumulative Probability |
Mean |
Standard Deviation |
Mean |
Variance |
|
1 |
0.0250 |
0.0000 |
1.0000 |
0.0000 |
1.0000 |
|
2 |
0.0500 |
-2.0000 |
2.0000 |
-2.0000 |
4.0000 |
|
3 |
0.1000 |
1.0000 |
0.5000 |
1.0000 |
0.2500 |
|
|
Frequency |
Critical Value |
|
1 |
0.0584 |
-1.9600 |
|
2 |
0.1031 |
-5.2897 |
|
3 |
0.1755 |
0.3592 |
If you are using UNISTAT in Stand-Alone Mode, click on the UNISTAT icon on the Output Medium Toolbar to send all output to UNISTAT spreadsheet. In Excel Add-In Mode select the output matrix as data.
Then select Statistics 1 → Distribution Functions → Probabilities and Critical Values again, but this time select the newly saved Critical Value column as [Variable] and leave [Parameter 1] and [Parameter 2] unchanged. Check the Variable Contains Critical Values box, select Normal from the distribution list and check all output options to obtain the following results:
Probabilities and Critical Values
Normal Distribution
Critical Value: Critical Value
Mean: Mean
Standard Deviation: StdDev
|
|
Critical Value |
Mean |
Standard Deviation |
Mean |
Variance |
|
1 |
-1.9600 |
0.0000 |
1.0000 |
0.0000 |
1.0000 |
|
2 |
-5.2897 |
-2.0000 |
2.0000 |
-2.0000 |
4.0000 |
|
3 |
0.3592 |
1.0000 |
0.5000 |
1.0000 |
0.2500 |
|
|
Frequency |
Cumulative Probability |
Complementary Probability |
|
1 |
0.0584 |
0.0250 |
0.9750 |
|
2 |
0.1031 |
0.0500 |
0.9500 |
|
3 |
0.1755 |
0.1000 |
0.9000 |
Example 2
Select File → New and then enter numbers from 0 to 5 into the first 6 rows of column 1 (C1) and select Statistics 1 → Distribution Functions → Probabilities and Critical Values. Select the data option Estimate Distribution Parameters, C1 as [Variable] from the variable list and Binomial from the distributions list. Accept the suggested parameters, number of trials = 5 and probability of success = .5, to obtain the following results:
Probabilities and Critical Values
Binomial Distribution
Critical Value: Success
|
|
Critical Value |
Number of Trials |
Probability of Success |
Mean |
Variance |
|
1 |
0.0000 |
5.0000 |
0.5000 |
2.5000 |
1.2500 |
|
2 |
1.0000 |
5.0000 |
0.5000 |
2.5000 |
1.2500 |
|
3 |
2.0000 |
5.0000 |
0.5000 |
2.5000 |
1.2500 |
|
4 |
3.0000 |
5.0000 |
0.5000 |
2.5000 |
1.2500 |
|
5 |
4.0000 |
5.0000 |
0.5000 |
2.5000 |
1.2500 |
|
6 |
5.0000 |
5.0000 |
0.5000 |
2.5000 |
1.2500 |
|
|
Frequency |
Cumulative Probability |
Complementary Probability |
|
1 |
0.0313 |
0.0313 |
0.9687 |
|
2 |
0.1562 |
0.1875 |
0.8125 |
|
3 |
0.3125 |
0.5000 |
0.5000 |
|
4 |
0.3125 |
0.8125 |
0.1875 |
|
5 |
0.1562 |
0.9687 |
0.0313 |
|
6 |
0.0313 |
1.0000 |
0.0000 |