6.2.3. Partial Correlation Matrix
Partial correlation is used to obtain the linear correlation between two variables after the effects of some other variables are filtered out. The latter are referred to as control variables or covariates. The number of covariates included gives the order of partial correlation. Here only the formula for a first order coefficient will be given as higher levels quickly get complicated:
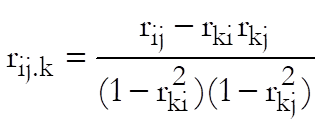
where i and j are the indices for variables to be correlated and k is for the covariate. All correlation coefficients on the right hand side of the equation are zero order Pearson Product Moment Correlation.
Like the Pearson-Spearman-Kendall Correlations Matrix procedure, Partial Correlation Matrix can compute more than one coefficient at a time and display the results in the form of a matrix. Each cell of the output matrix displays the correlation coefficient, its degrees of freedom and probability from the t-distribution. The degrees of freedom is calculated as:
![]()
where n is the number of valid cases and m is the number of covariates.
As of this version of UNISTAT, we have introduced a new regression based algorithm in calculating the partial correlations. Now it is possible to select an unlimited number of columns to be correlated or to be used as covariates. Missing values are handled for each correlation separately, i.e. any cases containing a missing value in the two variables correlated or in any selected covariates are omitted. Also, we now display the degrees of freedom rather than the number of cases in the output.
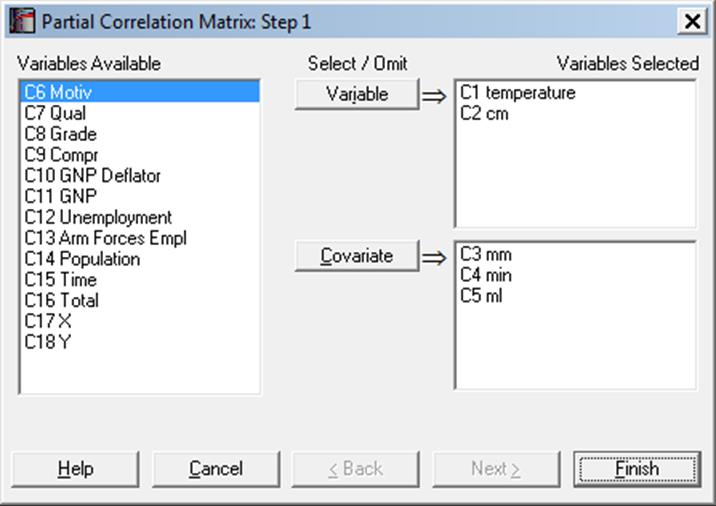
Select the columns to be correlated from the Variables Available list by clicking on [Variable] and covariates by clicking on [Covariate]. If no covariates are selected then the program will compute the zero order (Pearson) correlations. Coefficients will be displayed for only those pairs of variables and covariates with equal size.
Example
Example 20.2 on p. 439 from Zar, J. H. (2010). In this particular example, the partial correlation for each pair is computed using all the rest of the variables as covariates. Here it will be sufficient to generate one of the partial correlation coefficients.
Open REGRESS, select Statistics 1 → Correlation Coefficients → Partial Correlation and select temperature, cm (C1-C2) as [Variable]s and mm, min, ml (C3-C5) as [Covariate]s to obtain the following results:
Partial Correlation Matrix
3 Order Correlations
Controlling for: mm, min, ml
|
|
temperature |
|
|
cm |
|
|
|
|
Corr |
DoF |
2-Tail P |
Corr |
DoF |
2-Tail P |
|
Temperature |
|
|
|
0.1943 |
28 |
0.3036 |
|
cm |
0.1943 |
28 |
0.3036 |
|
|
|