6.2.1. Correlation Coefficients
Four Correlation Coefficients (Pearson product moment, Spearman rank, Kendall rank and point biserial) can be accessed under this menu item and the results presented in a single page of output.
Two or more columns can be selected by clicking on [Variable]. Correlations will be computed between all possible pairs, as long as the two columns have the same size. For each test, any pair of cases with one or more missing values is omitted and the degrees of freedom adjusted. Output Options Dialogue will allow you to choose which tests to appear in the output.
If a factor column is selected, then it is assumed that the data is not paired and only the point serial correlation is computed.
6.2.1.1. Pearson Product Moment Correlation
The aim of this correlation coefficient is to establish the degree of linear relationship between two variables. The coefficient is defined as the covariance of the two samples divided by the product of their standard deviations.
![]()
The probability value is based on Student’s t-distribution, where the t-statistic is calculated as:
![]()
![]()
This correlation coefficient is a relatively poor measure of association since it does not take into consideration the individual distributions of the two variables. The effect of outliers may be considerable. This makes it difficult to conclude that one linear correlation is significantly better than another. The nonparametric Correlation Coefficients Spearman’s rho and Kendall’s tau are more robust measures.
Pairs with one or more missing values are omitted and the degrees of freedom is adjusted. The output includes the correlation coefficient, its confidence interval, t-statistic, degrees of freedom and one- and two-tailed probabilities.
Example
Table 8.5 on p. 89, Gardner & Altman (2000). The null hypothesis “basal metabolic rate and total energy expenditure are not correlated” is tested at 95% confidence level.
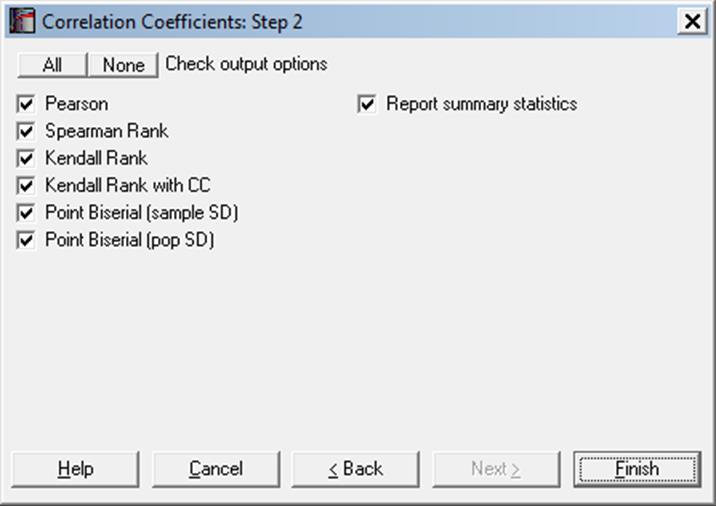
Open CORRCOEF, select Statistics 1 → Correlation Coefficients, select Basal and Energy (C1 and C2) as [Variable]s, select all output options (including the Report summary statistics box) and click [Next] to obtain the following results:
Correlation Coefficients
For Basal and Energy
|
|
Valid Cases |
Missing |
Mean |
Standard Deviation |
|
Basal |
13 |
0 |
5.6515 |
0.4650 |
|
Energy |
13 |
0 |
8.0662 |
1.2381 |
|
Paired |
13 |
0 |
|
|
|
|
Correlation Coefficient |
Degrees of Freedom |
* Test Statistic |
1-Tail Probability |
2-Tail Probability |
|
Pearson |
0.7283 |
11 |
3.5249 |
0.0024 |
0.0048 |
|
Spearman Rank |
0.6190 |
11 |
2.6139 |
0.0120 |
0.0241 |
|
Kendall Rank |
0.4258 |
|
2.0171 |
0.0218 |
0.0437 |
|
Kendall Rank with CC |
0.4387 |
|
2.0782 |
0.0188 |
0.0377 |
|
Point Biserial (sample SD) |
-0.7866 |
24 |
-6.2419 |
0.0000 |
0.0000 |
|
Point Biserial (pop SD) |
-0.8022 |
24 |
-6.5828 |
0.0000 |
0.0000 |
|
|
Lower 95% |
Upper 95% |
|
Pearson |
0.2961 |
0.9129 |
|
Spearman Rank |
0.1032 |
0.8724 |
|
Kendall Rank |
-0.1635 |
0.7912 |
|
Kendall Rank with CC |
-0.1481 |
0.7970 |
|
Point Biserial (sample SD) |
-0.8998 |
-0.5743 |
|
Point Biserial (pop SD) |
-0.9076 |
-0.6019 |
* Z-statistic for Kendall rank, t-statistic otherwise
This result shows that there is a significant correlation between the two variables.
6.2.1.2. Spearman’s Rank Correlation
Correlation between relative rankings of the two variables is measured rather than their nominal values. In this way each variable is transformed into a uniformly distributed variable and the effect of outliers is minimised. Spearman’s correlation coefficient (also called rho) is calculated as follows:
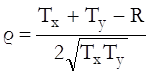
where R is the sum of squared differences between the ranks of corresponding cases of the two variables and:
![]()
![]()
where Kx and Ky are the sum of k3 – k where k is the number of ties at a given rank within each variable. The tail probability of rho is determined by comparing the following t-statistic with the Student’s t distribution:
![]()
![]()
Pairs with at least one missing value are omitted and the degrees of freedom is adjusted. The output includes the correlation coefficient, its confidence interval, t-statistic, degrees of freedom and one- and two-tailed probabilities.
Example
Example 19.13 on p. 401 from Zar, J. H. (2010). The null hypothesis “there is no correlation between the ranks of values in the two variables” is tested.
Open CORRCOEF, select Statistics 1 → Correlation Coefficients. Select X and Y (C3 and C4) as [Variable]s and select only the Spearman Rank output option to obtain the following results:
Correlation Coefficients
For X and Y
|
|
Correlation Coefficient |
Degrees of Freedom |
* Test Statistic |
1-Tail Probability |
2-Tail Probability |
|
Spearman Rank |
0.8511 |
10 |
5.1261 |
0.0002 |
0.0004 |
|
|
Lower 95% |
Upper 95% |
|
Spearman Rank |
0.5418 |
0.9574 |
* Z-statistic for Kendall rank, t-statistic otherwise
This result shows that there is a significant rank correlation and the null hypothesis should be rejected. Note that the denominator evaluates to 240, not 242 as in the book.
6.2.1.3. Kendall’s Rank Correlation
Like Spearman’s rho this is also a rank correlation coefficient (also called tau) and as such it has the same advantage over Pearson Product Moment Correlation. Additionally, it provides a more robust nonparametric measure by comparing the relative ordering of ranks rather than their numeric difference as in the case of Spearman’s rho. Kendall’s tau is calculated as:
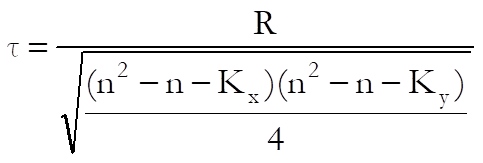
where R is the number of times a case is greater than other cases in both variables summed over all cases, and Kx and Ky are the sum of k2 – k where k is the number of ties at a given rank within each variable. For tau with continuity correction R is augmented by one.
The tail probability of tau is determined from the normal distribution with a standard deviation:
![]()
where:
· Px = sum of (k2 – k)(k – 2) for X
· Py = sum of (k2 – k)(k – 2) for Y
· Qx = sum of (k2 – k)(2k + 5) for X
· Qy = sum of (k2 – k)(2k + 5) for Y
· J = n2 – n.
Pairs with at least one missing value are omitted and the degrees of freedom is adjusted. The output includes the correlation coefficient, its confidence interval, t-statistic, degrees of freedom and one- and two-tailed probabilities.
Example
Table 56 on p. 160 from Cohen, L. & M. Holliday (1983). Ten trainees on a management course have been rated on a personality measure Introversion and on an Attitude to Change scale. The null hypothesis “there is no correlation between these two rankings” is tested.
Open CORRCOEF and select Statistics 1 → Correlation Coefficients. Select Introversion and Attitude (C5 and C6) as variables and select only the Kendall Rank output option to obtain the following results:
Correlation Coefficients
For Introversion and Attitude
|
|
Correlation Coefficient |
Degrees of Freedom |
* Test Statistic |
1-Tail Probability |
2-Tail Probability |
|
Kendall Rank |
0.6286 |
|
2.4545 |
0.0071 |
0.0141 |
|
Kendall Rank with CC |
0.6519 |
|
2.5455 |
0.0055 |
0.0109 |
|
|
Lower 95% |
Upper 95% |
|
Kendall Rank |
-0.0017 |
0.9014 |
|
Kendall Rank with CC |
0.0377 |
0.9086 |
* Z-statistic for Kendall rank, t-statistic otherwise
This result shows that there is a significant rank correlation at the 1% level, between the Introversion / extraversion rating and the Attitude to Change rating.
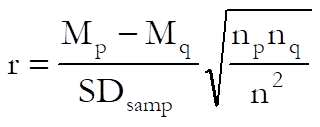
6.2.1.4. Point Biserial Correlation
This is an alternative to the linear (Pearson’s) correlation coefficient when the first variable is continuous and the second variable is binary. Let np and nq be the respective numbers of Ps and Qs and n the total number of valid cases. There are two alternative ways of calculating the coefficient:
Using sample standard deviation:
where SDsamp is the sample standard deviation of the two samples combined:
![]()
Using population standard deviation:
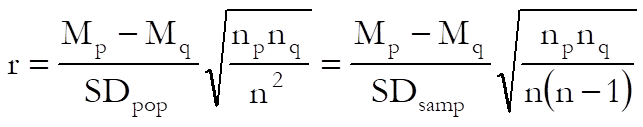
where SDpop is the population standard deviation of the two samples combined:
![]()
Before this release of UNISTAT, the version with sample standard deviation was used.
In both cases, the following t-value is compared with the t-distribution:
![]()
![]()
The data for this test can be in one of the three types supported for Two Sample Tests. If the last data option Test Statistics are Given is selected the program will prompt for sizes, means and standard deviations of the two samples. Missing values are omitted by case and the degrees of freedom is adjusted accordingly.
Example 1: Point biserial correlation using sample standard deviation
Table 57 on p. 164 from Cohen, L. & M. Holliday (1983). Examination scores of on and off campus social work students is given in one column of the table and their residence pattern in a second column.
Open CORRCOEF and select Statistics 1 → Correlation Coefficients. Select Score (C7) as [Variable] and Off Campus (C8) as [Factor], and select the Point Biserial and Report Summary Statistics output options to obtain the following results:
Correlation Coefficients
Data variable: Score
Subsample selected by: Off Campus = 0,1
|
|
Valid Cases |
Missing |
Mean |
Standard Deviation |
|
0 |
6 |
0 |
82.3333 |
5.1251 |
|
1 |
4 |
0 |
65.0000 |
4.0825 |
|
|
Correlation Coefficient |
Degrees of Freedom |
* Test Statistic |
1-Tail Probability |
2-Tail Probability |
|
Point Biserial |
0.8480 |
8 |
4.5260 |
0.0010 |
0.0019 |
|
|
Lower 95% |
Upper 95% |
|
Point Biserial |
0.4686 |
0.9633 |
* Z-statistic for Kendall rank, t-statistic otherwise
This result shows that there is a significant correlation at the 0.1% level between examinations scores and residence.
Example 2: Point biserial correlation using population standard deviation
Example 19.16 on p. 410 from Zar, J. H. (2010). The null hypothesis that there is no correlation between blood-clotting time and drug is tested.
Open CORRCOEF and select Statistics 1 → Correlation Coefficients. Select X1 (C12) as [Factor] and Y1 (C13) as [Variable], and select only the Point Biserial output option to obtain the following results:
Correlation Coefficients
Data variable: Y1
Subsample selected by: X1 = 0,1
|
|
Correlation Coefficient |
Degrees of Freedom |
* Test Statistic |
1-Tail Probability |
2-Tail Probability |
|
Point Biserial |
-0.5983 |
11 |
-2.4765 |
0.0154 |
0.0308 |
|
|
Lower 95% |
Upper 95% |
|
Point Biserial |
-0.8643 |
-0.0706 |
* Z-statistic for Kendall rank, t-statistic otherwise
Since P < 0.05, we reject the null hypothesis.