6.4.4. Unpaired Proportions
A 2 x 2 table is formed to perform the procedures listed under this topic. This can be done from raw data consisting of two columns (not necessarily of equal length) or by directly entering the four cell frequencies in the following order:
(1,1) contains the number of category 1s in the first sample
(1,2) contains the number of category 1s in the second sample
(2,1) contains the number of category 2s in the first sample
(2,2) contains the number of category 2s in the second sample
This data structure is explained in detail at the beginning of this chapter (see 6.0.7. 2 x 2 Tables). The user should take care to distinguish this table from a table formed on the same pair of columns by the Paired Proportions procedure. Here, the total table frequency is the sum of valid cases in sample 1 and sample 2, whereas in Paired Proportions (as in 2 x 2 cross-tabulation) the total frequency is the number of valid pairs.
When the four frequency values for a 2 x 2 table are already available in the spreadsheet, you do not have to type them again into the Cell Frequencies are Given dialogue. All statistics available under Binomial Proportion, Unpaired Proportions and Paired Proportions procedures are also available in Contingency Table and Cross-Tabulation procedures (see 6.6.2.3. 2 x 2 Table Statistics).
6.4.4.1. Difference Between Unpaired Proportions
Let:
![]()
and:
![]()
The confidence interval for the difference between two proportions uses the separate sample variance, which is defined as:
![]()
and the confidence interval is:
![]()
The pooled variance is used to test the difference between two proportions. The test statistic is based on the following normal approximation:
![]()
where:
![]()
and:
![]()
The pooled confidence limits are computed as:
![]()
Example 1
Example 4.10 on p. 125 from Armitage & Berry (2002). The effect of two treatments on the mortality rates of two random groups is assessed. The data is given in the form of a 2 x 2 table.
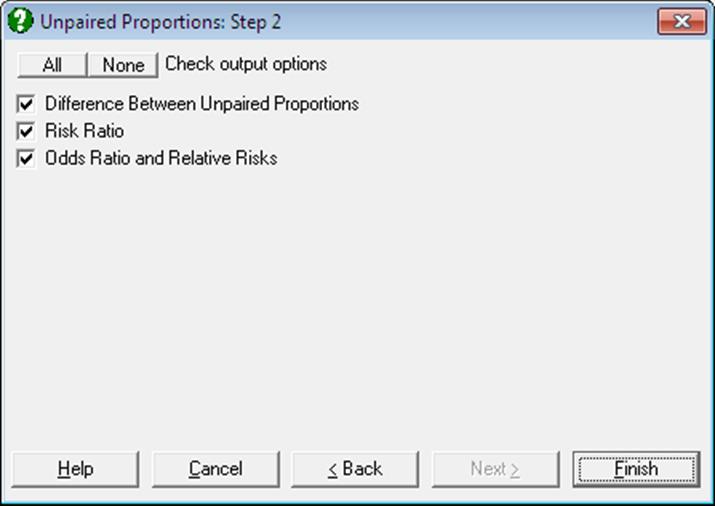
Select Statistics 1 → Nonparametric Tests (1-2 Samples) → Unpaired Proportions and select the data option 3 Cell Frequencies are Given. Enter 41 in (Sample 1 = 1), 64 in (Sample 2 = 1), 216 in (Sample 1 = 2) and 180 in (Sample 2 = 2). Select only the Difference Between Unpaired Proportions output option to obtain the following results:
Unpaired Proportions
Data option: Cell Frequencies are Given
|
|
Sample 1 |
Sample 2 |
Total |
|
1 |
41 |
64 |
105 |
|
2 |
216 |
180 |
396 |
|
Total |
257 |
244 |
501 |
Difference Between Unpaired Proportions
|
Proportion 1 = |
0.1595 |
|
Proportion 2 = |
0.2623 |
|
|
Difference |
Standard Error |
Z-Statistic |
1-Tail Probability |
2-Tail Probability |
|
Pooled Variance |
-0.1028 |
0.0364 |
-2.8247 |
0.0024 |
0.0047 |
|
Separate Variance |
|
0.0363 |
-2.8341 |
0.0023 |
0.0046 |
|
|
Lower 95% |
Upper 95% |
|
Pooled Variance |
-0.1741 |
-0.0315 |
|
Separate Variance |
-0.1738 |
-0.0317 |
In this example, Armitage and Berry report the Z-statistic and separate variance confidence interval only.
Example 2
Example on p. 32, Gardner & Altman (1989). Number of patients responding to treatment in two groups is given in the form of a 2 x 2 table.
Select Statistics 1 → Nonparametric Tests (1-2 Samples) → Unpaired Proportions and select the data option 3 Cell Frequencies are Given. Enter 61 in (Sample 1 = 1), 45 in (Sample 2 = 1), 19 in (Sample 1 = 2) and 35 in (Sample 2 = 2) to obtain the following results:
Unpaired Proportions
Data option: Cell Frequencies are Given
|
|
Sample 1 |
Sample 2 |
Total |
|
1 |
61 |
45 |
106 |
|
2 |
19 |
35 |
54 |
|
Total |
80 |
80 |
160 |
Difference Between Unpaired Proportions
|
Proportion 1 = |
0.7625 |
|
Proportion 2 = |
0.5625 |
|
|
Difference |
Standard Error |
Z-Statistic |
1-Tail Probability |
2-Tail Probability |
|
Pooled Variance |
0.2000 |
0.0748 |
2.6750 |
0.0037 |
0.0075 |
|
Separate Variance |
|
0.0731 |
2.7369 |
0.0031 |
0.0062 |
|
|
Lower 95% |
Upper 95% |
|
Pooled Variance |
0.0535 |
0.3465 |
|
Separate Variance |
0.0568 |
0.3432 |
In this example, Gardner and Altman report the separate variance confidence interval only.
6.4.4.2. Risk Ratio
Risk Ratio is defined as (see Gardner & Altman 2000, p. 58.):
![]()
where the logarithm of R has a standard error of:
![]()
and the confidence limits are reported as:
![]()
Example
Example on p. 59, Gardner & Altman (2000). Prevelance of Helicobacter pylori infection in preschool children according to mother’s histoty of ulcer is given as a 2 x 2 table.
Select Statistics 1 → Nonparametric Tests (1-2 Samples) → Unpaired Proportions and select the data option 3 Cell Frequencies are Given. Enter 6 in (Sample 1 = 1), 112 in (Sample 2 = 1), 16 in (Sample 1 = 2) and 729 in (Sample 2 = 2). Select only the Risk Ratio output option.
Unpaired Proportions
Data option: Cell Frequencies are Given
|
|
Sample 1 |
Sample 2 |
Total |
|
1 |
6 |
112 |
118 |
|
2 |
16 |
729 |
745 |
|
Total |
22 |
841 |
863 |
Risk Ratio
|
|
Value |
Lower 95% |
Upper 95% |
|
Risk Ratio |
2.0479 |
1.0131 |
4.1397 |
6.4.4.3. Odds Ratio and Relative Risks
The last part of output reports the odds ratio:
![]()
where the logarithm of OR has a standard error of:
![]()
and the confidence intervals, which are also known as logit limits, are:
![]()
For the odds ratio for paired cases see 6.4.5.4. Odds Ratio (Paired).
The relative risk for column 1 (cohort 1) is given as:
![]()
and its confidence interval:
![]()
where:
![]()
The relative risk for column 2 (cohort 2) is found by interchanging the indices.
Example
Example 4.11 on p. 128 from Armitage & Berry (2002). Association of bronchial carcinoma and asbestos exposure is investigated. The data is given in the form of a 2 x 2 table.
Select Statistics 1 → Nonparametric Tests (1-2 Samples) → Unpaired Proportions and select the data option 3 Cell Frequencies are Given. Enter 148 in (Sample 1 = 1), 372 in (Sample 2 = 1), 75 in (Sample 1 = 2) and 343 in (Sample 2 = 2). Select only the Odds Ratio and Relative Risks output option to obtain the following results:
Unpaired Proportions
Data option: Cell Frequencies are Given
|
|
Sample 1 |
Sample 2 |
Total |
|
1 |
148 |
372 |
520 |
|
2 |
75 |
343 |
418 |
|
Total |
223 |
715 |
938 |
Odds Ratio and Relative Risks
|
|
Value |
Lower 95% |
Upper 95% |
|
Odds Ratio |
1.8195 |
1.3290 |
2.4911 |
|
Exact |
|
1.3152 |
2.5283 |
|
Relative Risk (Cohort 1) |
1.5863 |
1.2401 |
2.0290 |
|
Relative Risk (Cohort 2) |
0.8718 |
0.8126 |
0.9353 |