6.1.4. Hotelling’s T-Squared Test
This is the multidimensional equivalent of One Sample t-Test. The null hypothesis “the population mean vector is equal to the given mean vector” is tested. Hotelling’s T-Squared statistic is computed as follows:
![]()
where:
·
![]() is the sample mean vector.
is the sample mean vector.
· µ is the expected mean vector (target level).
· S is the sample covariance matrix.
The test statistic (which is F-distributed) is found as:
![]()
df numerator = p
df denominator = n – p
where p is the number of variables and n is the number of valid cases.
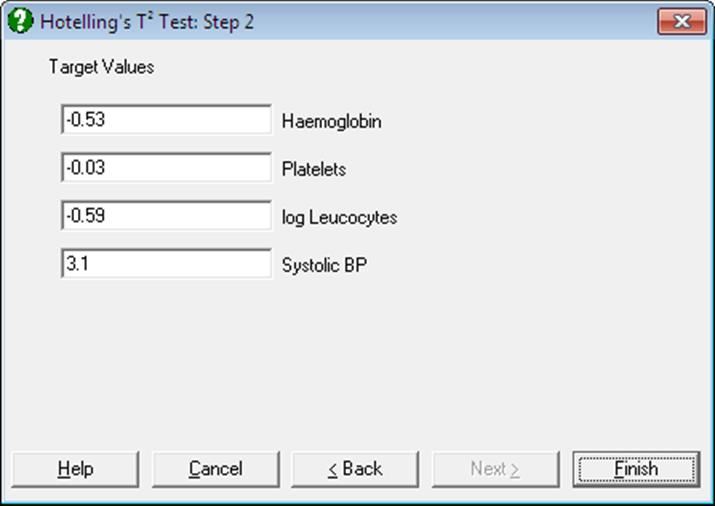
Select two or more columns by clicking on [Variable]. The next dialogue prompts for the given target levels, where the mean value of each variable is offered by default. Any rows containing at least one missing value are omitted. The output includes the sample covariance matrix, observed means, target levels, Hotelling’s T-Squared statistic and its tail probability.
Also see the related quality control procedure 9.3.4. Hotelling’s T-Squared Analysis.
Example
Example 13.3 on p. 474 Armitage & Berry (2002). Measurements are made on babies when they were 25 and 50 days old. The null hypothesis “there is no significant difference between measurements on 25 and 50 days” is tested.
Open PARTESTS and select Statistics 1 → Parametric Tests → Hotelling’s T-Squared Test. Select Haemoglobin, Platelets, log Leucocytes and Systolic BP (C10 to C13) as variables and all target levels as zero. The following results are obtained.
Hotelling’s T-Squared Test
|
|
Target Values |
Mean |
Difference |
|
Haemoglobin |
0.0000 |
-0.5300 |
-0.5300 |
|
Platelets |
0.0000 |
-0.0300 |
-0.0300 |
|
Log Leucocytes |
0.0000 |
-0.5900 |
-0.5900 |
|
Systolic BP |
0.0000 |
3.1000 |
3.1000 |
|
Hotelling’s T-Squared Statistic = |
7.4391 |
|
F(4,6) = |
1.2398 |
|
Right-Tail Probability = |
0.3869 |
The result is not significant at 10% level. Thus do not reject the null hypothesis.