9.5.1. Fourier Transform
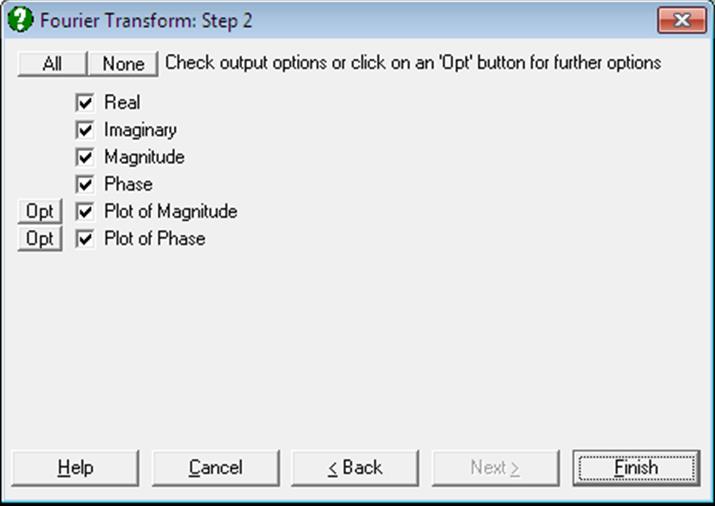
The real and imaginary parts of the series in the frequency domain can be displayed, as well as the corresponding magnitude and phase values and their plots.
![]()
![]()
where ap and bp are the real and complex components in the frequency domain respectively and atan2 function returns the arctangent of bp / ap in radians. The following inverse relationships should also hold:
![]()
![]()
If you wish to express the phase angle in degrees, rather than radians, then you may use a conversion factor of π / 180. The same conversion can be performed by the program automatically by entering the following line in Documents\Unistat10\Unistat10.ini file under the [Options] section:
FFTPhaseDegree=1
Example
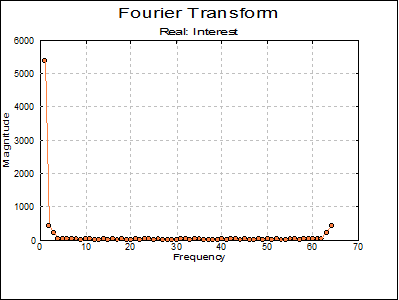
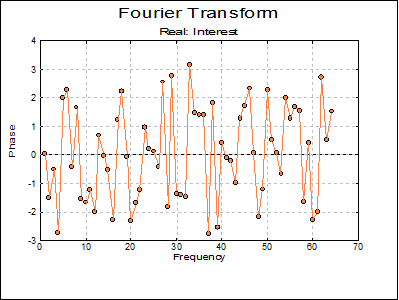
Open DEMODATA and select Statistics 2 → Fourier Analysis → Fourier Transform. From the Variable Selection Dialogue select Interest (C4) as [Real] to obtain the following results:
Fourier Transform
Real: Interest
|
|
Real |
Imaginary |
Magnitude |
Phase (Radian) |
|
1 |
5408.4193 |
0.0000 |
5408.4193 |
0.0000 |
|
2 |
21.4881 |
-416.1937 |
416.7481 |
-1.5192 |
|
3 |
223.7763 |
-122.4555 |
255.0905 |
-0.5007 |
|
4 |
-29.7381 |
-13.8112 |
32.7888 |
-2.7068 |
|
5 |
-14.7492 |
32.7994 |
35.9630 |
1.9934 |
|
6 |
-30.7761 |
37.7633 |
48.7159 |
2.2546 |
|
7 |
42.1814 |
-18.9490 |
46.2421 |
-0.4222 |
|
8 |
-3.1800 |
39.3871 |
39.5152 |
1.6514 |
|
9 |
0.4593 |
-15.9255 |
15.9321 |
-1.5420 |
|
10 |
-5.0154 |
-50.0637 |
50.3142 |
-1.6706 |
|
11 |
14.9913 |
-45.5162 |
47.9215 |
-1.2526 |
|
12 |
-10.0253 |
-21.5218 |
23.7422 |
-2.0067 |
|
… |
…16.0507 |
… |
… |
… |
|
48 |
-24.6684 |
-34.0238 |
42.0256 |
-2.1981 |
|
49 |
4.8234 |
-13.0566 |
13.9190 |
-1.2169 |
|
50 |
-21.2454 |
25.1352 |
32.9112 |
2.2725 |
|
51 |
20.7350 |
11.7082 |
23.8122 |
0.5140 |
|
52 |
40.1326 |
2.0183 |
40.1833 |
0.0502 |
|
53 |
16.0507 |
-12.5679 |
20.3857 |
-0.6643 |
|
54 |
-10.0253 |
21.5218 |
23.7422 |
2.0067 |
|
55 |
14.9913 |
45.5162 |
47.9215 |
1.2526 |
|
56 |
-5.0154 |
50.0637 |
50.3142 |
1.6706 |
|
57 |
0.4593 |
15.9255 |
15.9321 |
1.5420 |
|
58 |
-3.1800 |
-39.3871 |
39.5152 |
-1.6514 |
|
59 |
42.1814 |
18.9490 |
46.2421 |
0.4222 |
|
60 |
-30.7761 |
-37.7633 |
48.7159 |
-2.2546 |
|
61 |
-14.7492 |
-32.7994 |
35.9630 |
-1.9934 |
|
62 |
-29.7381 |
13.8112 |
32.7888 |
2.7068 |
|
63 |
223.7763 |
122.4555 |
255.0905 |
0.5007 |
|
64 |
21.4881 |
416.1937 |
416.7481 |
1.5192 |
Since there are only 58 rows in the variable Interest, it is first padded by the program automatically up to the next power of 2 (64) by the mean value of the variable.