5.2.5. Expected Frequencies
The distribution parameters of a random variable are estimated and the theoretical distribution with the estimated parameters is displayed.
First choose the form of data. This can be ungrouped data, data with frequency counts, or grouped data (see 5.0.2. One-Sample Data Types). Select the data column (if the data is ungrouped) or columns (if the data is with frequency counts or already grouped) containing the random variable and the distribution function. There is a check box on the same dialogue to set the form of output; Table or Character Histogram.
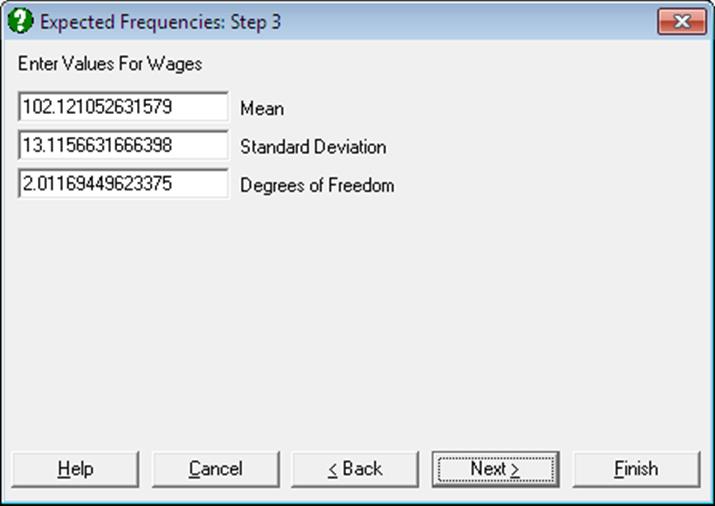
The Expected Frequencies procedure is not implemented for hypergeometric distribution. When any other distribution is selected, the program will ask for the distribution parameters. The suggested numbers are those which are estimated by the program. To display the estimated distribution accept the program’s suggestions. A parameter which cannot be estimated is assigned the number -99. In this case either abort the procedure or enter a number of your own choice.
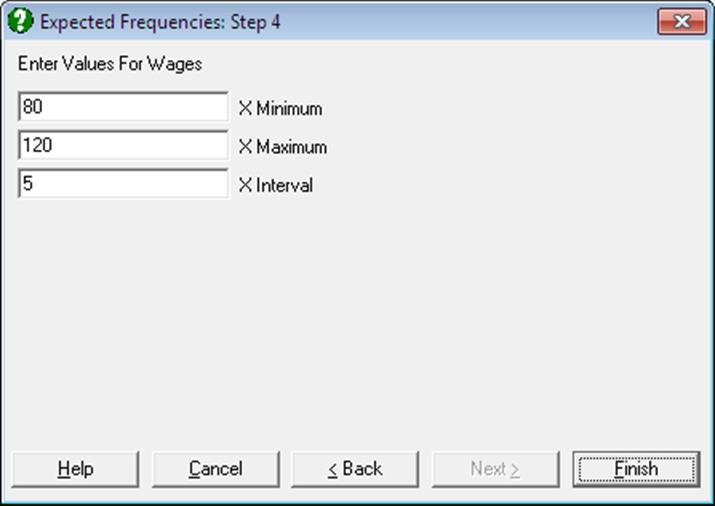
After entering the distribution parameters a dialogue is displayed which is similar to the one used in the Frequency Distributions procedure. The first three fields are for the lower bound of the first class, the upper bound of the last class and the class interval respectively.
If the form of output is Table, class midpoints, observed and expected frequencies will be displayed in a table. The second alternative is a character histogram of observed frequencies where expected frequencies are represented by (+) and are superimposed on the horizontal frequency bars.
The goodness of fit is also displayed by performing a two-sample chi-square test on the observed and expected frequency columns. Note that the degrees of freedom is adjusted by the number of parameters estimated for the distribution (see 6.3.1.2. Two Sample Chi-Square Test).
Example
Let us start by generating a column of Random Numbers using the gamma distribution. First clear all data in the spreadsheet by selecting File → New and then select Statistics 1 → Distribution Functions → Random Numbers, from the distributions list Gamma and enter 100 for the Variable Size. At the parameter dialogue enter alpha = 2 and beta = .8 to obtain a skewed distribution. If you are using UNISTAT in Stand-Alone Mode, make Data Processor active and click on the UNISTAT icon on the Input Panel. This will add the column of Random Numbers GammaRand to the Data Processor. If you are using UNISTAT in Excel Add-In Mode, then highlight the column of Random Numbers. Then select Statistics 1 → Distribution Functions → Expected Frequencies and GammaRand as [Variable] and check the Character Histogram box. The distribution list will still show the Gamma distribution. Accept the default values in the next two dialogues. You will obtain different numbers as they are generated randomly. Shapes of the histograms should look similar.
Expected Frequencies
Gamma Distribution
Observed: GammaRand
Alpha: 2.2988
Beta: 0.8697
|
Class |
Mid-Point |
Frequency |
0.0000 33.0000 |
|
1 |
0.0000 |
7 |
*********+* |
|
2 |
1.2500 |
32 |
*************************************************+ |
|
3 |
2.5000 |
33 |
*******************************************+****** |
|
4 |
3.7500 |
14 |
********************** + |
|
5 |
5.0000 |
7 |
*********** + |
|
6 |
6.2500 |
5 |
******+* |
|
7 |
7.5000 |
1 |
**+ |
|
8 |
8.7500 |
0 |
+ |
|
9 |
10.0000 |
0 |
+ |
|
10 |
11.2500 |
1 |
** |
|
Chi-Square Statistic = |
10.5291 |
|
Degrees of Freedom = |
7 |
|
Right-Tail Probability = |
0.1605 |