9.3.4. Hotelling’s T-Squared Analysis
This is also known as the multivariate control analysis where multiple variables can be controlled in a single chart using the Hotelling’s T-Squared statistic. The Hotelling’s T-Squared statistic is the multivariate equivalent of the t-statistic (see 6.1.1. t- and F-Tests and 6.1.4. Hotelling’s T-Squared Test). In this case, the Hotelling T-Squared statistic is calculated using the average within sample covariance matrix as an estimate of the population covariance matrix, rather than using each sample covariance matrix to calculate T-Squared for that sample only.
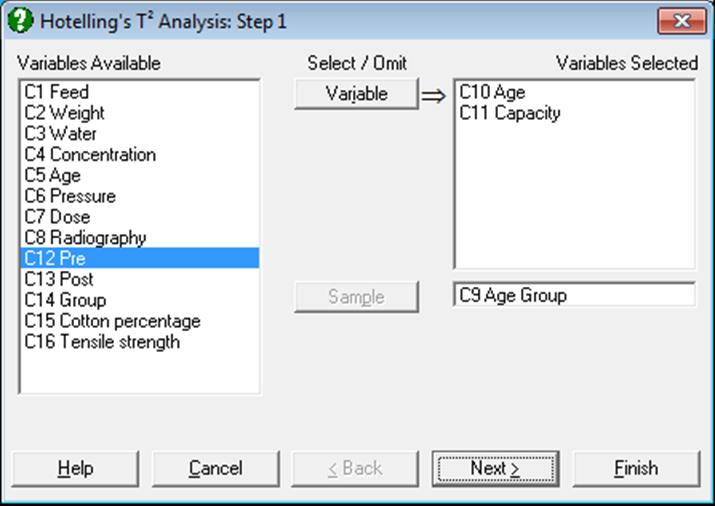
To run this procedure, you will need to select two or more variables by clicking on [Variable] and one [Sample] column for subgroups.
9.3.4.1. Hotelling’s T-Squared Inputs
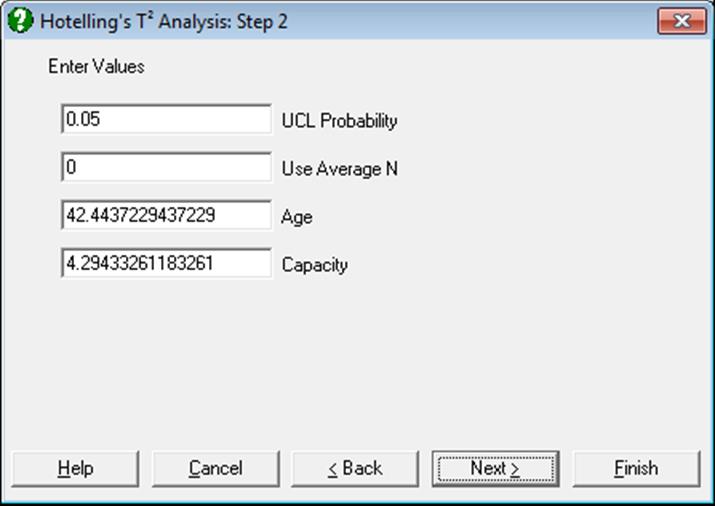
The parameter input dialogue asks for the following:
UCL Probability: This is critical probability of the test and is defined as the probability of declaring the process out of control when it is not out of control. This is equivalent to the Type I error probability.
Use Average N: If this is 1 then the average sample size will be used to determine the critical value for each sample. This will mean that the UCL will be a straight line. Otherwise, if the samples have different sample sizes, then the UCL will vary from sample to sample.
Variable n: You can enter a target level for each variable selected. The default value suggested is the sample mean of each variable.
9.3.4.2. Hotelling’s T-Squared Output Options
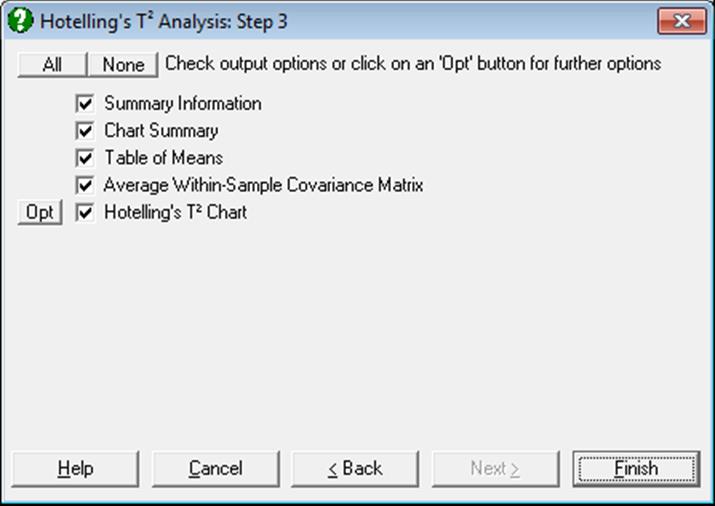
The Output Options Dialogue offers the following choices:
Summary Information: For each sample, the sample size, Hotelling’s T-Squared statistic, the estimated F- and its associated probability are displayed in a table. The estimated F-value is a transformation from the T-Squared statistic to a variable which follows the F distribution.
Chart Summary: For each sample, the sample size, Hotelling’s T-Squared statistic and the UCL are displayed in a table.
Table of Means: For each sample, the sample means of all variables are displayed in a table.
Average Within-sample Covariance Matrix: This is the average of each sample covariance matrix. It is used in calculating the Hotelling’s T-Squared statistic, instead of taking a different sample covariance matrix for each sample.
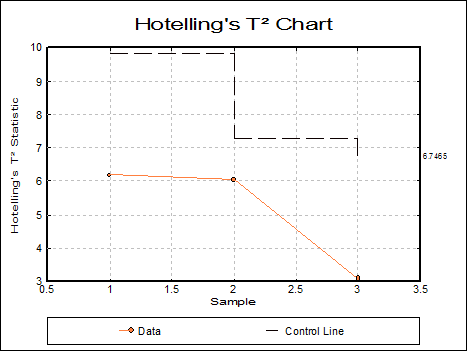
Hotelling’s T-Squared Chart: T-Squared and UCL values are plotted against the group numbers. Clicking the [Opt] button situated to the left of the Hotelling’s T-Squared Chart option will place the plot in UNISTAT’s Graphics Editor. The plot can be further customised and annotated using the tools available under the graphics window’s Edit menu.
9.3.4.3. Hotelling’s T-Squared Example
Open ANOTESTS and select Statistics 2 → Quality Control → Hotelling’s T-Squared Analysis. Select Age and Capacity (C10 – C11) as [Variable]s and Age Group (C9) as [Sample]. In the next dialogue accept the default values.
Hotelling’s T-Squared Analysis
Summary Information
Sample: Age Group
F-Statistic with (2, N-2) Degrees of Freedom
|
Sample |
N |
T-Squared |
F-Statistic |
Probability |
|
1 |
12 |
6.1748 |
2.5728 |
0.1255 |
|
2 |
28 |
6.0366 |
2.8027 |
0.0790 |
|
3 |
44 |
3.1140 |
1.4862 |
0.2379 |
Chart Summary
|
Sample |
N |
T-Squared |
UCL |
|
1 |
12 |
6.1748 |
9.8468 |
|
2 |
28 |
6.0366 |
7.2563 |
|
3 |
44 |
3.1140 |
6.7465 |
|
Beta Probability = |
0.0500 |
Table of Means
|
Sample |
Age |
Capacity |
|
1 |
49.7500 |
3.9492 |
|
2 |
37.7857 |
4.4718 |
|
3 |
39.7955 |
4.4620 |
|
Overall |
42.4437 |
4.2943 |
Average Within-Sample Covariance Matrix
|
|
Age |
Capacity |
|
Age |
103.8656 |
-5.1348 |
|
Capacity |
-5.1348 |
0.6704 |