6.5.3. Multisample Median Test
Data entry is in multisample format (see 6.0.4. Multisample Tests). Each sample can be entered in a separate column (not necessarily of equal length), or they can be stacked in one or more columns and subsamples defined by an unlimited number of factor columns. Missing values are omitted by case.
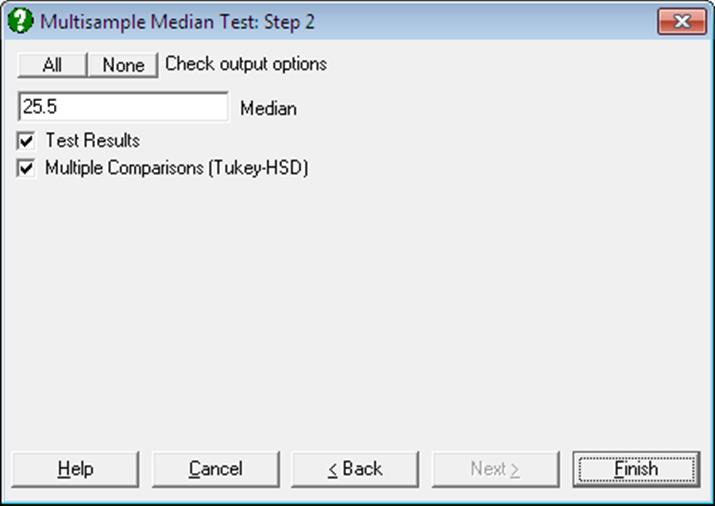
A further dialogue allows you to override the median computed from data and enter any values. The two output options can also be selected from the same dialogue.
6.5.3.1. Multisample Median Test Results
Like the Two Sample Median Test, this is also used to determine whether the samples have been drawn from populations with the same median. But here, the number of samples is not limited to two. The number of cases less than or equal to and greater than the overall median is found for each sample. Then the chi-square statistic is calculated from the obtained frequencies.
The one-tail probability is reported using the chi-square distribution with M – 1 degrees of freedom.
6.5.3.2. Median Multiple Comparisons
A Tukey-HSD type comparison is made between all possible pairs of groups. The value used in comparisons is the number of cases greater than the overall median for each sample (i.e. the first column of the table displayed in test results).
If the total number of cases N is an odd number the standard error is computed as:
![]()
If N is an even number, then the standard error is:
![]()
where n is the harmonic mean of group sizes.
6.5.3.3. Multisample Median Test Example
Examples 10.12 on p. 201 and 11.11 on p. 227 from Zar, J. H. (1999). The null hypothesis “median elm tree height is the same on all four sides of a building” is tested at a 95% significance level. If they are found to be different, then we would also like to know which ones.
Open NONPARM1, select Statistics 1 → Nonparametric Tests (Multisample) → Multisample Median Test and include North, East, South and West (C19 to C22) in the analysis by clicking [Variable]. Check the Test Results and the Multiple Comparisons boxes to obtain the following results:
Multisample Median Test
|
|
Cases |
> Median |
<= Median |
|
North |
12 |
4 |
8 |
|
East |
12 |
3 |
9 |
|
South |
12 |
10 |
2 |
|
West |
12 |
6 |
6 |
|
Total |
48 |
23 |
25 |
|
Median = |
7.9000 |
|
Chi-Square Statistic = |
9.6000 |
|
Degrees of Freedom = |
3 |
|
Right-Tail Probability = |
0.0223 |
Since the right tail probability is less than 5% the null hypothesis is rejected. In the 5th edition of Biostatistical Analysis (2010), Examples 10.12 on p. 219 and 11.9 on p. 245, Zar employs a different Method where observations at the median are omitted. With this approach the total number of valid cases is 46 and the chi-squared statistic is 11.182.
Next we ask the question which groups are significantly different at 95%.
Multiple Comparisons (Tukey-HSD)
Method: 95% Tukey-HSD interval.
** denotes significantly different pairs. Vertical bars show homogeneous subsets.
A pairwise test result is significant if its q stat value is greater than the table q.
|
Group |
Cases |
Mean |
East |
North |
West |
South |
|
|
East |
12 |
3.0000 |
|
|
|
** |
| |
|
North |
12 |
4.0000 |
|
|
|
|
|| |
|
West |
12 |
6.0000 |
|
|
|
|
|| |
|
South |
12 |
10.0000 |
** |
|
|
|
| |
|
Comparison |
Difference |
Standard Error |
q Stat |
Table q |
Probability |
|
South – East |
7.0000 |
1.7504 |
3.9991 |
3.6332 |
0.0242 |
|
West – East |
3.0000 |
1.7504 |
1.7139 |
3.6332 |
0.6192 |
|
North – East |
1.0000 |
1.7504 |
0.5713 |
3.6332 |
0.9777 |
|
South – North |
6.0000 |
1.7504 |
3.4278 |
3.6332 |
0.0726 |
|
West – North |
2.0000 |
1.7504 |
1.1426 |
3.6332 |
0.8507 |
|
South – West |
4.0000 |
1.7504 |
2.2852 |
3.6332 |
0.3696 |
|
Comparison |
Lower 95% |
Upper 95% |
Result |
|
South – East |
0.6406 |
13.3594 |
** |
|
West – East |
-3.3594 |
9.3594 |
|
|
North – East |
-5.3594 |
7.3594 |
|
|
South – North |
-0.3594 |
12.3594 |
|
|
West – North |
-4.3594 |
8.3594 |
|
|
South – West |
-2.3594 |
10.3594 |
|
|
Homogeneous Subsets: |
|
|
Group 1: |
East North West |
|
Group 2: |
North West South |
The overall conclusion is that although elm trees on the East and South definitely have different heights at 95%, nothing can be said about the ones on the North and West.