5.3.2. Normal Probability Plot
Multisample data can be entered in the form of multiple columns or data columns classified by factor columns. If at least one factor is selected, then a further dialogue will pop up asking for the combination of factor levels to be included.
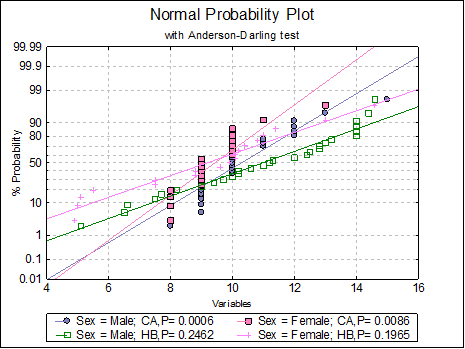
If the data lies on a near-straight line, then it is said to conform to the normal distribution. By default, an Anderson-Darling Test of normality is also performed and its tail probability is reported in the legend. Smaller p-values indicate non-normality.
Edit → Data Series dialogue allows connecting data points with lines or drawing a line of best fit with or without confidence intervals. It is possible to plot probabilities or complementary probabilities.
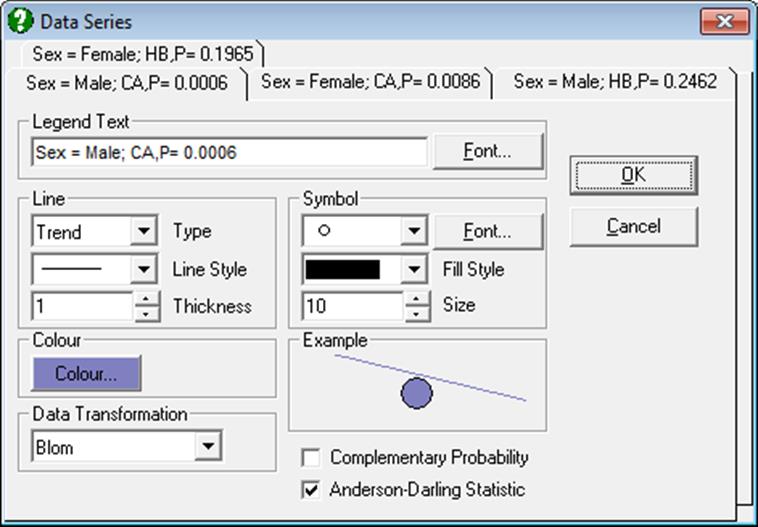
Data itself is plotted on the X-axis with all scaling options available (see Scale Type) and the corresponding Y-axis (expected normal probability) values are computed from the inverse normal cdf employing a scale transformation and plotted with a probit scale. The following approximations to the normal scores are supported (see Blom, G. 1958), where Blom transformation is the default:
Blom scores:
![]()
Tukey scores:
![]()
Van der Waerden scores:
![]()
Note that due to these transformations a Normal Probability Plot is different from X-Y Plots with a probit axis.