8.1.3. K-Means Cluster Analysis
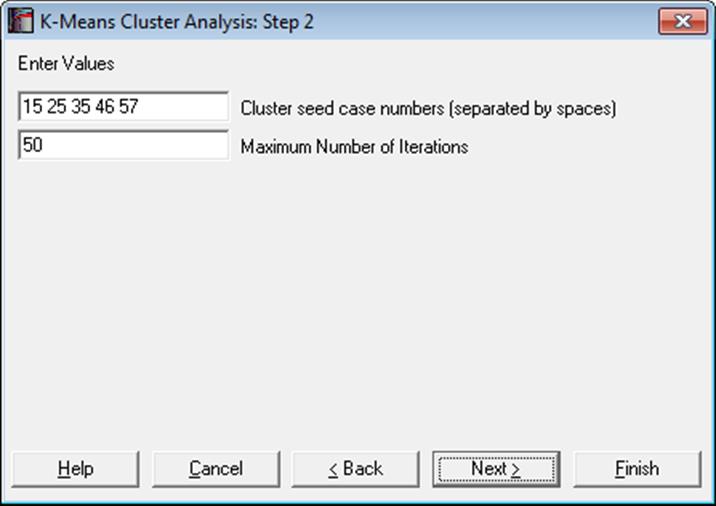
This procedure groups M points in N dimensions into K clusters. It should be preferred to hierarchical methods when the number of cases to be clustered is large. The user selects K initial points from the rows of the data matrix. An iterational algorithm minimises the within-cluster sum of squares. See Hartigan, J. A. and Wong, M. A. (1979), p. 100.
The following output options are provided:
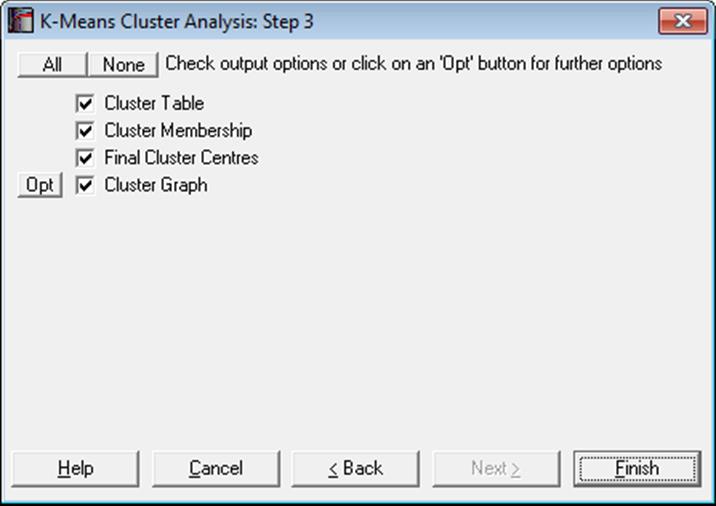
Cluster Table: The number of cases in each cluster, their percentages and the minimised sum of squares are displayed. The number of clusters formed is determined by the number of initial points selected.
Cluster Membership: This is similar to the membership table for hierarchical methods. The number of the cluster which includes the case is displayed.
Final Cluster Centres: The k-means clustering algorithm computes centroids for each cluster. The final configuration is displayed in a table.
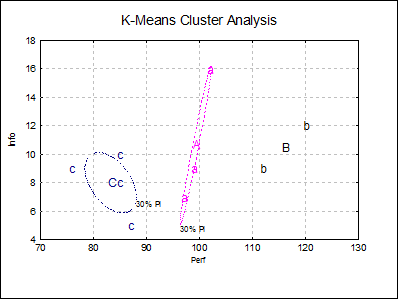
Cluster Graph: This is similar to the Cluster Graph for hierarchical methods. It is possible to display the cluster centroids on the same graph, using the Edit → XY Points dialogue. A cluster centroid will be represented by a capital letter. Unlike the hierarchical methods, here the number of clusters cannot be changed, because it is fixed by the number of seeds selected at the start of the analysis.
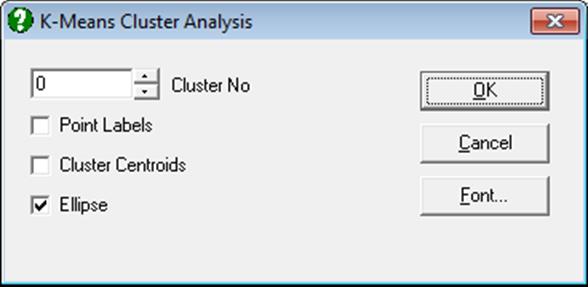
If the Cluster No field is zero, all groups will be displayed simultaneously. If this field is set to any other number less than or equal to the number of clusters, then only the cases belonging to that cluster will be displayed.
For 2D plots, by checking the Ellipse box on, you can draw interval curves for the mean of Y (confidence) and / or actual Y (prediction) values at one or more confidence levels. For further details see Ellipse Confidence and Prediction Intervals in 4.1.1.1.1. Line.
Example
Open MULTIVAR, select Statistics 2 → Cluster Analysis → K-Means Cluster Analysis, and select Perf, Info, Verbexp and Age (C1 to C4) as [Variable]s. Select 2 4 8 as seeds at the next dialogue and accept the default number of maximum iterations to obtain the following results:
K-Means Cluster Analysis
Variables Selected: Perf, Info, Verbexp, Age
Cluster Table
|
Cluster |
Seed |
Cases |
Percentage |
SSQ |
|
1 |
2 |
3 |
33.33% |
220.3800 |
|
2 |
4 |
2 |
22.22% |
109.2200 |
|
3 |
8 |
4 |
44.44% |
140.7875 |
Cluster Membership
|
Observation |
Cluster |
|
1 |
3 |
|
2 |
1 |
|
3 |
2 |
|
4 |
1 |
|
5 |
3 |
|
6 |
3 |
|
7 |
2 |
|
8 |
3 |
|
9 |
1 |
Final Cluster Centres
|
Seed |
Perf |
Info |
Verbexp |
Age |
|
2 |
99.3333 |
10.6667 |
36.0000 |
7.8333 |
|
4 |
116.0000 |
10.5000 |
36.0000 |
7.8000 |
|
8 |
83.2500 |
8.0000 |
32.2500 |
6.6250 |