UNISTAT® Graphics Engine
UNISTAT features one of the best graphics subsystems that can be found in any statistical package.
UNISTAT supports full on-screen object editing of graphs. All text, legends, and the graph itself can be drag-dropped and resized and new text and shape objects added. The final configuration can be saved as a graphics template file for future use. All graphics attributes including fonts, colours, titles, legends, axes, frame, tick marks, line styles, line thickness can be controlled from the graphics menu.
The current chart or report can be sent to Word, Excel or to the web browser with a single click. Graphs can be also be exported to other applications via the clipboard or as a file in the form of bitmap images or Windows metafiles.
For further information see UNISTAT User’s Guide sections Graphics Editor and X-Y Plots.
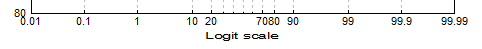
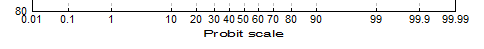
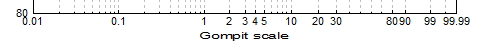
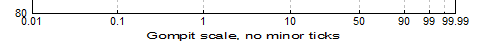
Axis Scaling Options
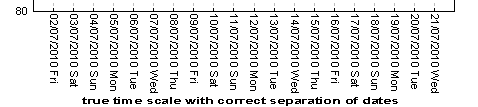
UNISTAT can display axis titles and X-axis tick labels at 0°, 90°, 270° rotations or in top-to-bottom orientation, format the scale numbers and enter mathematical expressions for the minimum, maximum, minor and major tick values (e.g. 2*Pi()). Scale types available include linear, log base 10, log base e, log to any user-defined base, reciprocal, logit, probit, gompit and loglog. For further information see User’s Guide section Scale Type.


Text Formatting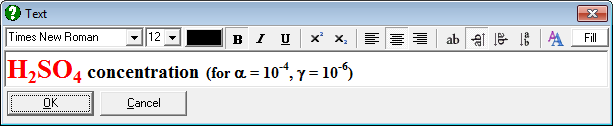
It is possible to mix different fonts and sub / superscripts in any text object.
You can copy and paste formatted text between UNISTAT text objects and Microsoft Word or other Windows applications.
Titles can be displayed at 0º, 90º, 270º rotations.
|
Multiple Y-Axes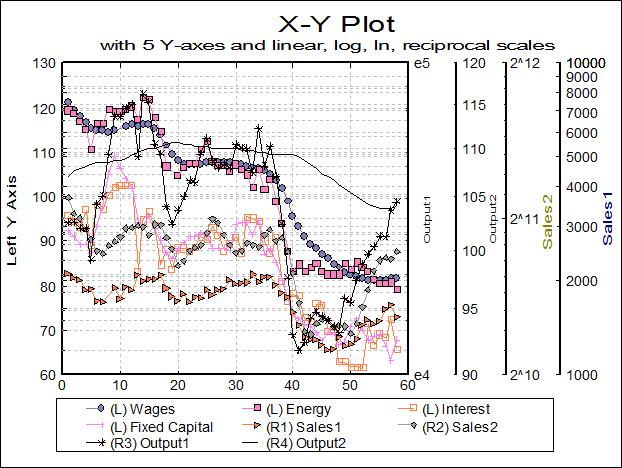
Up to five y-axes can be displayed; one on the left and four on the right, allowing representation of diverse data sets on the same graph.
Each axis can be individually controlled with all available scaling options.
|
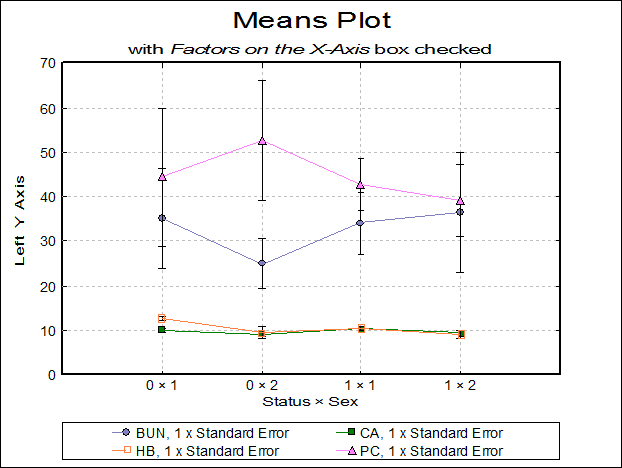
Means Plot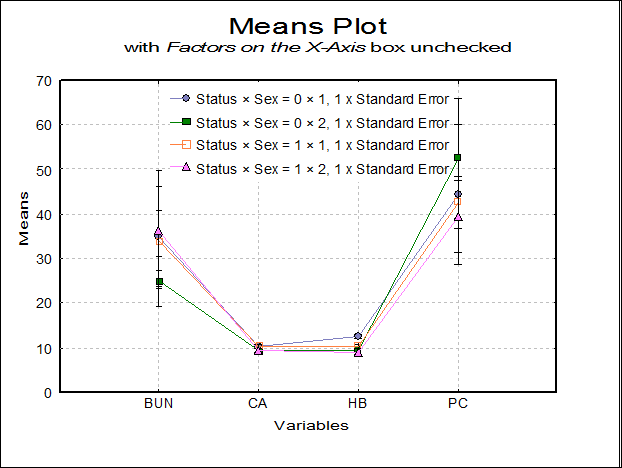
X-Y Plots, Polar Plot, Bar Chart, Area Chart and Ribbon Chart procedures allow plotting the means of the data series with optional error bars. Error bar options include t- and Z-interval (at any confidence level), standard error and standard deviation (with user-defined multipliers) and variance. For further information see User’s Guide Section Means Plot.
It is also possible to select a continuous variable for the X-Axis, where one or more Y-Axis variables have multiple values corresponding to the same X-Axis variable value. A typical case is the dose-response plot where there are several response variable values for each dose level.
|
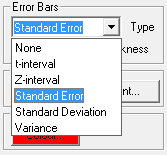
Error Bars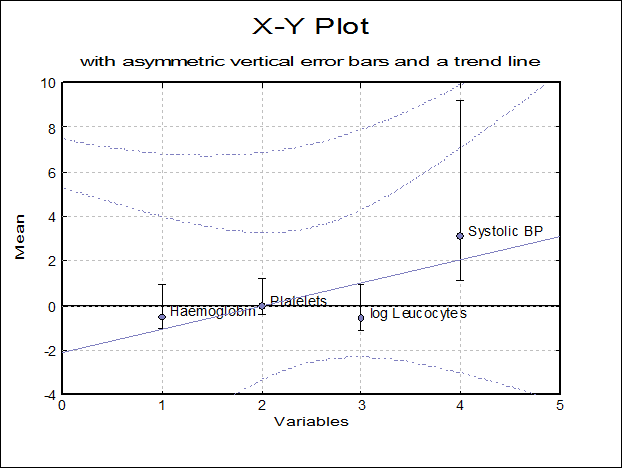
In addition to the error bar options for means plot, you can define any variable to be displayed as error bars.
This is a powerful feature allowing vertical / horizontal, symmetric / asymmetric error bars for each data point on 2D and 3D scatter plots, bar, area and ribbon charts. For further information see User’s Guide Section Error Bars.
|
Trend Lines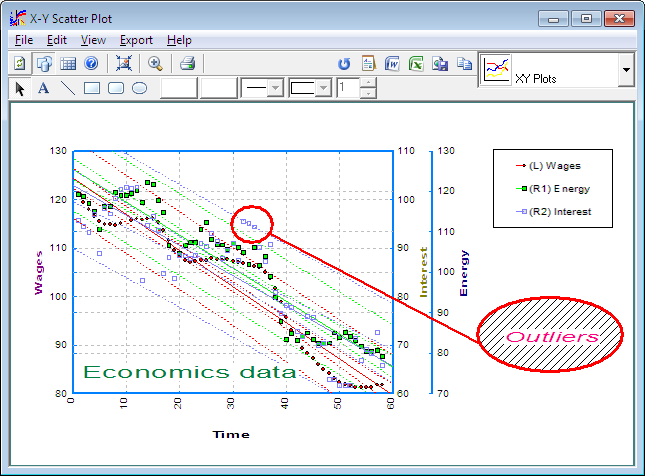
You can display a line of best fit (linear least squares) for each data series separately.
Confidence interval curves for the mean of Y and / or actual Y values can be drawn at any confidence level.
When only one variable is plotted, it is also possible to fit another curve on the series.
|
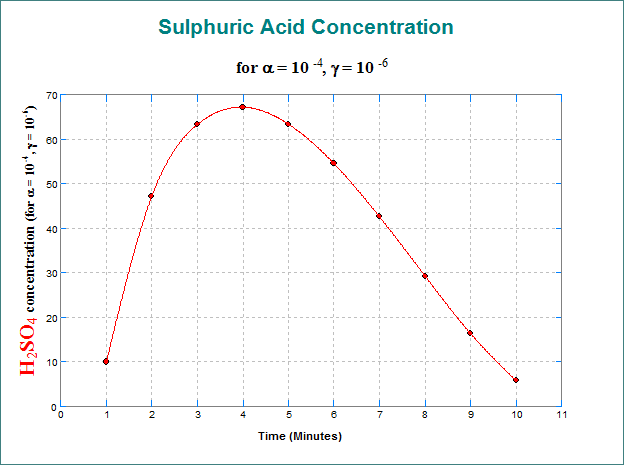
Curve Fitting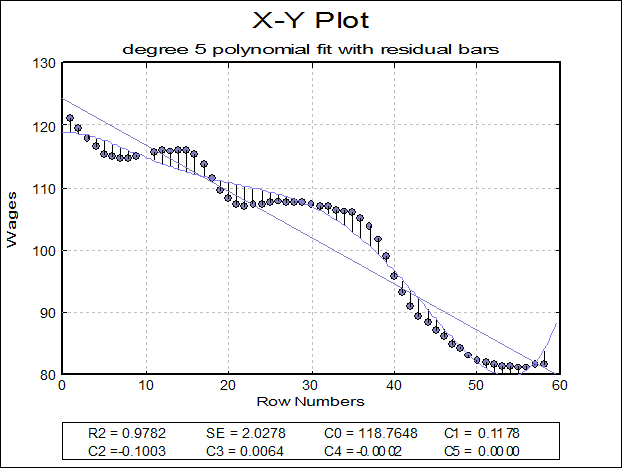
Five different types of curves can be fitted on a bivariate plot, Neville, rational, polynomial, exponential and geometric.
R-squared and standard error values and estimated coefficients are displayed in the legend for polynomial, geometric and exponential fits. It is possible to display residual bars on the graph. For further information see User’s Guide Section Curve Fitting.
|
Surface Fitting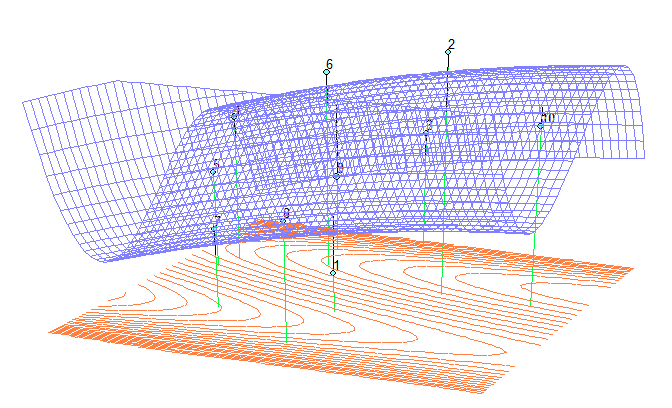
It is possible to fit 3D surfaces, linear regression planes, polynomial and weighted average surfaces on X-Y-Z scatter plots.
Contour lines of the surface can be shown on either or both of the bottom and top planes. Alternatively, a separate 2D contour map can be drawn with extended annotation possibilities. For further information see User’s Guide Section Surface Fitting.
|
3D Options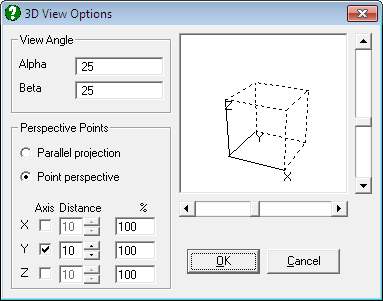
All 3D graphics procedures allow rotation and selection of the view point, as well as selecting one of parallel, one-point, or three-point perspectives.
The Spin Plot procedure permits the drawing of an X-Y-Z scatter diagram of three variables and rotation of the plot in all directions in real time.
|
Interactive Graphics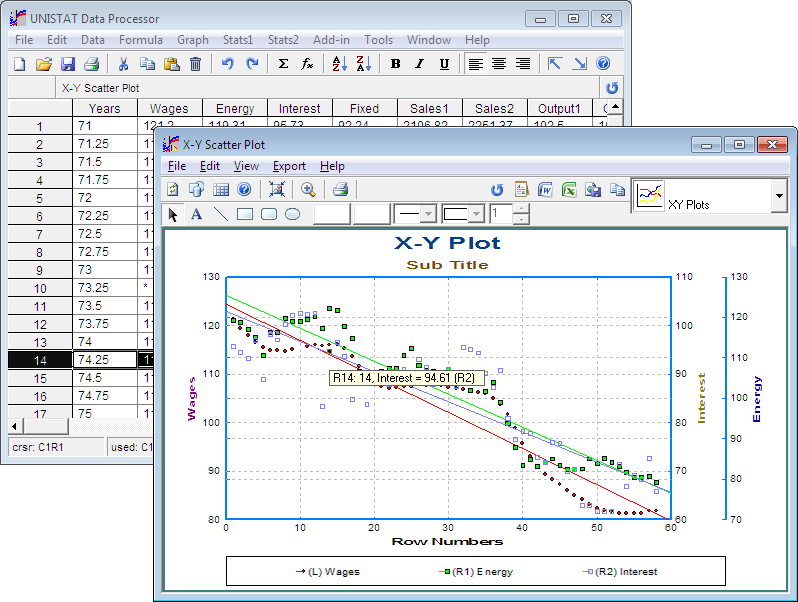
You can display information about a data point by pressing the and holding the right-mouse button on it. 2D and 3D scatter diagrams, 3D spin, polar, normal probability and regression plots support this feature. In stand-alone mode, the row of the spreadsheet containing the point is also highlighted simultaneously.
In this way, it is easy to determine which points are outliers in the data set. In regression plots, if the <Delete> key is pressed while a point is highlighted, then this point will be omitted and the graph redrawn with a new regression equation.
|