Hierarchical Cluster Analysis in Excel with UNISTAT
The UNISTAT statistics add-in extends Excel with Hierarchical Cluster Analysis capabilities.
For further information visit UNISTAT User's Guide section 8.1.1. Hierarchical Cluster Analysis.
Here we provide a sample output from the UNISTAT Excel statistics add-in for data analysis.
Hierarchical Cluster Analysis
Variables Selected: temperature, cm, mm, min, ml
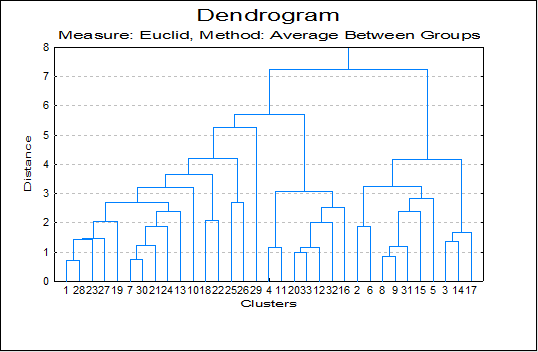
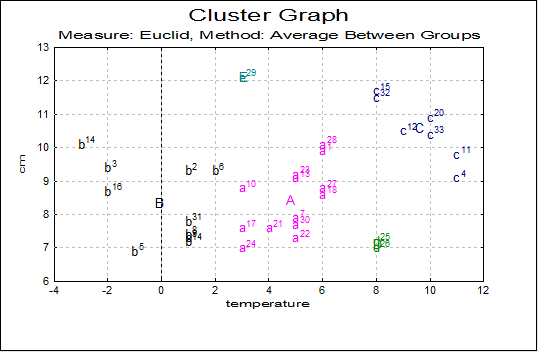
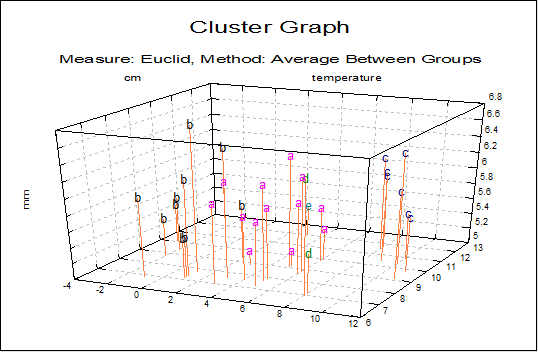
Measure: Euclid, Method: Average Between Groups
History
| Step | Combined1 | Combined2 | Cases | Distance |
|---|---|---|---|---|
| 1 | 1 | 28 | 2 | 0.7071 |
| 2 | 7 | 30 | 2 | 0.7368 |
| 3 | 8 | 9 | 2 | 0.8615 |
| 4 | 20 | 33 | 2 | 0.9731 |
| 5 | 4 | 11 | 2 | 1.1456 |
| 6 | 12 | 20 | 3 | 1.1586 |
| 7 | 8 | 31 | 3 | 1.1744 |
| 8 | 7 | 21 | 3 | 1.2139 |
| 9 | 3 | 14 | 2 | 1.3757 |
| 10 | 1 | 23 | 3 | 1.4414 |
| 11 | 1 | 27 | 4 | 1.4695 |
| 12 | 3 | 17 | 3 | 1.6848 |
| 13 | 2 | 6 | 2 | 1.8661 |
| 14 | 7 | 24 | 4 | 1.8858 |
| 15 | 12 | 32 | 4 | 2.0192 |
| 16 | 1 | 19 | 5 | 2.0531 |
| 17 | 18 | 22 | 2 | 2.0878 |
| 18 | 8 | 15 | 4 | 2.3828 |
| 19 | 7 | 13 | 5 | 2.3862 |
| 20 | 12 | 16 | 5 | 2.5362 |
| 21 | 25 | 26 | 2 | 2.6975 |
| 22 | 1 | 7 | 10 | 2.6986 |
| 23 | 5 | 8 | 5 | 2.8392 |
| 24 | 4 | 12 | 7 | 3.0621 |
| 25 | 1 | 10 | 11 | 3.1927 |
| 26 | 2 | 5 | 7 | 3.2481 |
| 27 | 1 | 18 | 13 | 3.6434 |
| 28 | 2 | 3 | 10 | 4.1802 |
| 29 | 1 | 25 | 15 | 4.2144 |
| 30 | 1 | 29 | 16 | 5.2553 |
| 31 | 1 | 4 | 23 | 5.6904 |
| 32 | 1 | 2 | 33 | 7.2418 |
Character Dendrogram
             1+-----+
            28+-----+------+
            23+------------+
            27+------------+----+
            19+-----------------+-----+
             7+------+                |
            30+------+---+            |
            21+----------+-----+      |
            24+----------------+---+  |
            13+--------------------+--+---+
            10+---------------------------+---+
            18+-----------------+             |
            22+-----------------+-------------+----+
            25+-----------------------+            |
            26+-----------------------+------------+--------+
            29+---------------------------------------------+---+
             4+---------+                                       |
            11+---------+----------------+                      |
            20+--------+                 |                      |
            33+--------++                |                      |
            12+---------+-------+        |                      |
            32+-----------------+---+    |                      |
            16+---------------------+----+----------------------+-------------+
             2+---------------+                                               |
             6+---------------+------------+                                  |
             8+-------+                    |                                  |
             9+-------+-+                  |                                  |
            31+---------+----------+       |                                  |
            15+--------------------+---+   |                                  |
             5+------------------------+---+-------+                          |
             3+-----------+                        |                          |
            14+-----------+--+                     |                          |
            17+--------------+---------------------+--------------------------+
Cluster Table
| Cases | Percentage | Within SSQ | Average Distance | Minimum | Maximum | |
|---|---|---|---|---|---|---|
| Cluster 1 | 13 | 39.4% | 52.7065 | 1.8791 | 0.6205 | 3.1403 |
| Cluster 2 | 10 | 30.3% | 56.1270 | 2.2688 | 1.5402 | 3.5851 |
| Cluster 3 | 7 | 21.2% | 20.5565 | 1.5938 | 0.8141 | 2.2454 |
| Cluster 4 | 2 | 6.1% | 3.6382 | 1.3487 | 1.3487 | 1.3487 |
| Cluster 5 | 1 | 3.0% | 0.0000 | 0.0000 | 0.0000 | 0.0000 |
Cluster Centroids
| Cluster 1 | Cluster 2 | Cluster 3 | Cluster 4 | Cluster 5 | Overall | |
|---|---|---|---|---|---|---|
| temperature | 4.7692 | -0.1000 | 9.5714 | 8.0000 | 3.0000 | 4.4545 |
| cm | 8.4308 | 8.3400 | 10.5571 | 7.1000 | 12.1000 | 8.8848 |
| mm | 5.8385 | 5.8800 | 6.0143 | 5.9500 | 5.4000 | 5.8818 |
| min | 2.1538 | 2.5700 | 2.9143 | 2.8500 | 4.1000 | 2.5424 |
| ml | 2.3800 | 3.0520 | 1.7471 | 2.6200 | 2.7200 | 2.4742 |
Distance Between Centroids
| Cluster 1 | Cluster 2 | Cluster 3 | Cluster 4 | Cluster 5 | |
|---|---|---|---|---|---|
| Cluster 1 | 0.0000 | 4.9340 | 5.3472 | 3.5726 | 4.5485 |
| Cluster 2 | 4.9340 | 0.0000 | 10.0146 | 8.2108 | 5.1409 |
| Cluster 3 | 5.3472 | 10.0146 | 0.0000 | 3.8976 | 6.9494 |
| Cluster 4 | 3.5726 | 8.2108 | 3.8976 | 0.0000 | 7.2024 |
| Cluster 5 | 4.5485 | 5.1409 | 6.9494 | 7.2024 | 0.0000 |
Cluster Membership
| Observation | Cluster |
|---|---|
| 1 | 1 |
| 2 | 2 |
| 3 | 2 |
| 4 | 3 |
| 5 | 2 |
| 6 | 2 |
| 7 | 1 |
| 8 | 2 |
| 9 | 2 |
| 10 | 1 |
| 11 | 3 |
| 12 | 3 |
| 13 | 1 |
| 14 | 2 |
| 14 | 2 |
| 15 | 3 |
| 16 | 2 |
| 17 | 1 |
| 18 | 1 |
| 20 | 3 |
| 21 | 1 |
| 22 | 1 |
| 23 | 1 |
| 24 | 1 |
| 25 | 4 |
| 26 | 4 |
| 27 | 1 |
| 28 | 1 |
| 29 | 5 |
| 30 | 1 |
| 31 | 2 |
| 32 | 3 |
| 33 | 3 |