UNISTAT® as Excel Add-In
Best-practice statistical data analysis in Microsoft Excel is difficult with existing add-ins and other software tools. UNISTAT is different, adding the power and accuracy of a full-featured statistical package to your existing analysis and visualization workflow.
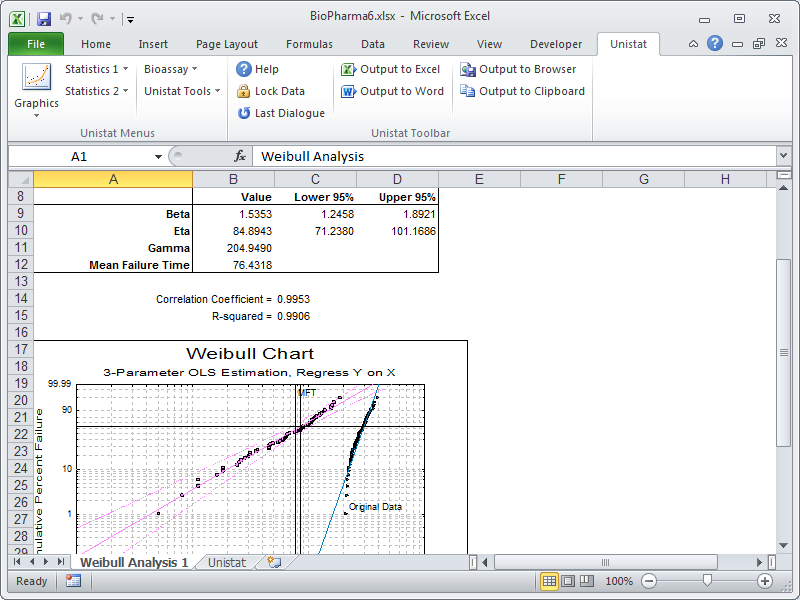
Using UNISTAT as Excel addin is easy. All you need to do is select a block of data and then select a procedure from the UNISTAT menus. UNISTAT’s procedure dialogues are intuitive to use and you will not feel as if you are dealing with another program.
By default, UNISTAT will create its output in a new Excel worksheet. You will also have the option to send the same output to Word or HTML for the web.
All numeric results from UNISTAT have up to 15-digit precision, though you can choose to display them with only the desired number of digits. This prevents the build-up of rounding errors when output from one procedure is used as input for another procedure.
Statistical analysis in Excel
- X-Y Plots
- Polar Plot
- Spectral Diagram
- Fan Grid Plot
- X-Y-Z Scatter Plot
- X-Y-Z Grid Plot
- X-Y-Z Spin Plot
- Pie Chart
- Bar Chart
- Area Chart
- Ribbon Chart
- 3D Bar Chart
- High-Low-Close Chart
- Plot of 2D Functions
- Plot of 3D Functions
- Plot & Roots of Polynomials
- Plot of Distribution Functions
- Box-Whisker, Dot and Bar Plots
- Normal Probability Plot
- Histogram
- 3D Histogram
- Bland-Altman Plot
- Ladder Plot
- Matrix Plot
- Rectangular Plot
- Icon Plots
- Summary Statistics
- Confidence Intervals
- Quantiles
- Sample Statistics
- Frequency Distributions
- Stem and Leaf Plot
- Sequence Diagram
- Scatter Diagram
- Cumulative Probability
- Critical Value
- Probabilities and Critical Values
- Random Numbers
- Expected Frequencies
- t- and F-Tests
- Equivalence Test for Means
- Parametric Tests Matrix
- Hotelling’s T2 Test
- Correlation Coefficients
- Pearson-Spearman-Kendall Matrix
- Partial Correlation Matrix
- Intraclass Correlation Coefficients
- Chi-square Tests
- Kolmogorov-Smirnov Tests
- Normality Tests
- Outlier Tests
- Unpaired Samples
- Paired Samples
- Binomial Proportion
- Unpaired Proportions
- Paired Proportions
- Kruskal-Wallis One-Way ANOVA
- Jonckheere’s Trend
- Multisample Median Test
- Friedman Two-Way ANOVA
- Quade Two-Way ANOVA
- Kendall’s Concordance Coeff
- Page’s L Trend
- Cochran’s Q
- Kappa Test Inter-Category
- Kappa Test Inter-Observer
- Contingency Table
- Cross-Tabulation
- Break-Down
- Matrix Statistics
- Linear Regression
- Polynomial Regression
- Stepwise Regression
- Nonlinear Regression
- Logit / Probit / Gompit
- Logistic Regression
- Multinomial Regression
- Poisson Regression
- Box-Cox Regression
- Analysis of Variance
- General Linear Model
- Table of Means
- Homogeneity of Variance Tests
- Multiple Comparisons
- Regression with Replicates
- Heterogeneity of Regression
- Sample Size & Power: One Sample
- Sample Size & Power: Two Samples
- Sample Size & Power: Variance
- Sample Size & Power: Correlation
- Sample Size & Power: Two Correlations
- Sample Size & Power: Two Proportions
- Sample Size & Power: ANOVA
- Sample Size & Power: Phi Distribution
- Meta Analysis
- Hierarchical Cluster Analysis
- K-th Neighbour Cluster Analysis
- K-Means Cluster Analysis
- Multiple Discriminant Analysis
- K-th Neighbour Discriminant Analysis
- Multidimensional Scaling
- Principal Components
- Factor Analysis
- Canonical Correlations
- Reliability Analysis
- ARIMA
- Brown’s Exponential Forecasting
- Holt’s Linear Forecasting
- Winters’ Additive Seasonal Forecasting
- Winters’ Multiplicative Seasonal Forecasting
- Neumann Trend Test
- Variable Control Charts
- Attribute Control Charts
- Pareto Chart
- Hotelling’s T2 Analysis
- Weibull Analysis
- Process Capability Analysis
- Data Transformation
- Gauge R&R Analysis
- Life Table
- Kaplan-Meier Analysis
- Survival Comparison Statistics
- Cox Regression
- Fourier Transform
- Inverse Fourier Transform
- Parallel Line Method
- Slope Ratio Method
- Quantal Response Method
- Four-Parameter Logistic Regression
- Combination of Assays
- Cylinder-Plate 5+1 Assay