General Linear Model in Excel with UNISTAT
The UNISTAT statistics add-in extends Excel with General Linear Model capabilities.
For further information visit UNISTAT User's Guide section 7.3.2. General Linear Model.
Here we provide a sample output from the UNISTAT Excel statistics add-in for data analysis.
General Linear Model
ANOVA
Dependent Variable: Score
| Due To | Sum of Squares | DoF | Mean Square | F-Stat | Prob | |
|---|---|---|---|---|---|---|
| Constant | 4800.000 | 1 | 4800.000 | 35.644 | 0.0000 | |
| Between Subjects | 991.500 | 3 | 330.500 | |||
| Anxiety | 10.083 | 1 | 10.083 | a | ||
| Tension | 8.333 | 1 | 8.333 | a | ||
| Anxiety x Tension | 80.083 | 1 | 80.083 | a | ||
| Error Between | 893.000 | 0 | 0.000 | |||
| Within Subjects | 266.500 | 44 | 6.057 | |||
| Trial | 991.500 | 3 | 330.500 | b | ||
| Anxiety x Trial | 8.417 | 3 | 2.806 | b | ||
| Tension x Trial | 12.167 | 3 | 4.056 | b | ||
| Anxiety x Tension x Trial | 12.750 | 3 | 4.250 | b | ||
| Error Within | 0.000 | 32 | 0.000 | |||
| Explained | 1123.333 | 15 | 74.889 | 17.795 | 0.0000 | |
| Error | 134.667 | 32 | 4.208 | |||
| Total | 1258.000 | 47 | 26.766 |
| R-squared | 0.8930 |
|---|---|
| Adjusted R-squared | 0.8428 |
a F-Statistic: Error Between
b F-Statistic: Error Within
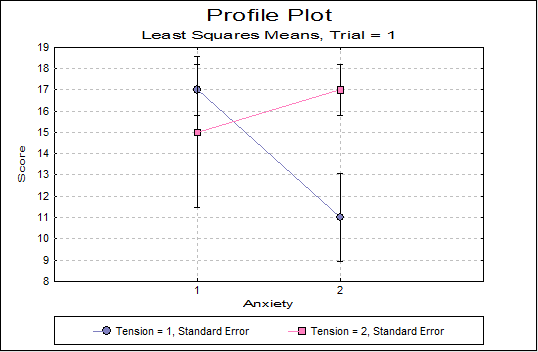
Table of Least Squares Means
| Least Squares Means | Standard Error | t-Statistic | Probability | Lower 95% | Upper 95% | |
|---|---|---|---|---|---|---|
| Constant | 10.0000 | 0.2961 | 33.7727 | 0.0000 | 9.3969 | 10.6031 |
| Anxiety = 1 | 9.5417 | 0.4187 | 22.7864 | 0.0000 | 8.6887 | 10.3946 |
| 2 | 10.4583 | 0.4187 | 24.9754 | 0.0000 | 9.6054 | 11.3113 |
| Tension = 1 | 9.5833 | 0.4187 | 22.8859 | 0.0000 | 8.7304 | 10.4363 |
| 2 | 10.4167 | 0.4187 | 24.8759 | 0.0000 | 9.5637 | 11.2696 |
| Anxiety x Tension = 1 x 1 | 12.1667 | 1.5668 | 7.7653 | 0.0000 | 8.9752 | 15.3581 |
| 1 x 2 | 10.1667 | 3.2972 | 3.0834 | 0.0042 | 3.4505 | 16.8828 |
| 2 x 1 | 6.1667 | 1.5668 | 3.9358 | 0.0004 | 2.9752 | 9.3581 |
| 2 x 2 | 12.1667 | 0.5922 | 20.5450 | 0.0000 | 10.9604 | 13.3729 |
| Trial = 1 | 16.5000 | 0.5922 | 27.8625 | 0.0000 | 15.2937 | 17.7063 |
| 2 | 11.5000 | 0.5922 | 19.4193 | 0.0000 | 10.2937 | 12.7063 |
| 3 | 7.7500 | 0.5922 | 13.0869 | 0.0000 | 6.5437 | 8.9563 |
| 4 | 4.2500 | 0.5922 | 7.1767 | 0.0000 | 3.0437 | 5.4563 |
| Anxiety x Trial = 1 x 1 | 20.0000 | 1.4506 | 13.7876 | 0.0000 | 17.0453 | 22.9547 |
| 1 x 2 | 12.0000 | 3.2436 | 3.6996 | 0.0008 | 5.3930 | 18.6070 |
| 1 x 3 | 14.3333 | 3.2436 | 4.4190 | 0.0001 | 7.7264 | 20.9403 |
| 1 x 4 | 8.0000 | 2.5125 | 3.1841 | 0.0032 | 2.8823 | 13.1177 |
| 2 x 1 | 14.0000 | 1.4506 | 9.6513 | 0.0000 | 11.0453 | 16.9547 |
| 2 x 2 | 14.0000 | 1.4506 | 9.6513 | 0.0000 | 11.0453 | 16.9547 |
| 2 x 3 | 14.0000 | 1.4506 | 9.6513 | 0.0000 | 11.0453 | 16.9547 |
| 2 x 4 | 14.0000 | 1.4506 | 9.6513 | 0.0000 | 11.0453 | 16.9547 |
| Tension x Trial = 1 x 1 | 20.0000 | 1.4506 | 13.7876 | 0.0000 | 17.0453 | 22.9547 |
| 1 x 2 | 18.0000 | 3.8379 | 4.6901 | 0.0000 | 10.1825 | 25.8175 |
| 1 x 3 | 20.3333 | 3.8379 | 5.2981 | 0.0000 | 12.5159 | 28.1508 |
| 1 x 4 | 14.0000 | 1.4506 | 9.6513 | 0.0000 | 11.0453 | 16.9547 |
| 2 x 1 | 8.0000 | 2.5125 | 3.1841 | 0.0032 | 2.8823 | 13.1177 |
| 2 x 2 | 14.0000 | 1.4506 | 9.6513 | 0.0000 | 11.0453 | 16.9547 |
| 2 x 3 | 14.0000 | 1.4506 | 9.6513 | 0.0000 | 11.0453 | 16.9547 |
| 2 x 4 | 14.0000 | 1.4506 | 9.6513 | 0.0000 | 11.0453 | 16.9547 |
| Anxiety x Tension x Trial = 1 x 1 x 1 | 17.0000 | 1.1844 | 14.3534 | 0.0000 | 14.5875 | 19.4125 |
| 1 x 1 x 2 | 18.0000 | 4.2704 | 4.2151 | 0.0002 | 9.3015 | 26.6985 |
| 1 x 1 x 3 | 12.3333 | 4.2704 | 2.8881 | 0.0069 | 3.6349 | 21.0318 |
| 1 x 1 x 4 | 14.0000 | 4.2704 | 3.2784 | 0.0025 | 5.3015 | 22.6985 |
| 1 x 2 x 1 | 15.0000 | 3.5532 | 4.2216 | 0.0002 | 7.7624 | 22.2376 |
| 1 x 2 x 2 | 12.0000 | 2.6484 | 4.5311 | 0.0001 | 6.6054 | 17.3946 |
| 1 x 2 x 3 | 7.3333 | 3.5532 | 2.0639 | 0.0472 | 0.0958 | 14.5709 |
| 1 x 2 x 4 | 6.3333 | 3.9282 | 1.6123 | 0.1167 | -1.6681 | 14.3348 |
| 2 x 1 x 1 | 11.0000 | 2.0514 | 5.3621 | 0.0000 | 6.8214 | 15.1786 |
| 2 x 1 x 2 | 8.0000 | 2.0514 | 3.8997 | 0.0005 | 3.8214 | 12.1786 |
| 2 x 1 x 3 | 3.3333 | 2.0514 | 1.6249 | 0.1140 | -0.8453 | 7.5119 |
| 2 x 1 x 4 | 2.3333 | 1.1844 | 1.9701 | 0.0575 | -0.0792 | 4.7459 |
| 2 x 2 x 1 | 17.0000 | 1.1844 | 14.3534 | 0.0000 | 14.5875 | 19.4125 |
| 2 x 2 x 2 | 14.0000 | 1.1844 | 11.8204 | 0.0000 | 11.5875 | 16.4125 |
| 2 x 2 x 3 | 9.3333 | 1.1844 | 7.8803 | 0.0000 | 6.9208 | 11.7459 |
| 2 x 2 x 4 | 8.3333 | 1.1844 | 7.0360 | 0.0000 | 5.9208 | 10.7459 |
Coefficients
| Coefficient | Standard Error | t-Statistic | Probability | Lower 95% | Upper 95% | |
|---|---|---|---|---|---|---|
| Constant | 8.3333 | 1.1844 | 7.0360 | 0.0000 | 5.9208 | 10.7459 |
| Anxiety = 1 | -6.0000 | 1.6750 | -3.5821 | 0.0011 | -9.4118 | -2.5882 |
| 2 | * | * | * | * | * | * |
| Tension = 1 | -6.0000 | 1.6750 | -3.5821 | 0.0011 | -9.4118 | -2.5882 |
| 2 | * | * | * | * | * | * |
| Anxiety x Tension = 1 x 1 | 7.6667 | 2.3688 | 3.2365 | 0.0028 | 2.8416 | 12.4917 |
| 1 x 2 | * | * | * | * | * | * |
| 2 x 1 | * | * | * | * | * | * |
| 2 x 2 | * | * | * | * | * | * |
| Trial = 1 | 8.6667 | 1.6750 | 5.1742 | 0.0000 | 5.2548 | 12.0785 |
| 2 | 5.6667 | 1.6750 | 3.3831 | 0.0019 | 2.2548 | 9.0785 |
| 3 | 1.0000 | 1.6750 | 0.5970 | 0.5547 | -2.4118 | 4.4118 |
| 4 | * | * | * | * | * | * |
| Anxiety x Trial = 1 x 1 | 4.3333 | 2.3688 | 1.8294 | 0.0767 | -0.4917 | 9.1584 |
| 1 x 2 | 2.0000 | 2.3688 | 0.8443 | 0.4048 | -2.8250 | 6.8250 |
| 1 x 3 | 3.6667 | 2.3688 | 1.5479 | 0.1315 | -1.1584 | 8.4917 |
| 1 x 4 | * | * | * | * | * | * |
| 2 x 1 | * | * | * | * | * | * |
| 2 x 2 | * | * | * | * | * | * |
| 2 x 3 | * | * | * | * | * | * |
| 2 x 4 | * | * | * | * | * | * |
| Tension x Trial = 1 x 1 | 5.6667 | 2.3688 | 2.3922 | 0.0228 | 0.8416 | 10.4917 |
| 1 x 2 | 2.0000 | 2.3688 | 0.8443 | 0.4048 | -2.8250 | 6.8250 |
| 1 x 3 | 2.6667 | 2.3688 | 1.1258 | 0.2686 | -2.1584 | 7.4917 |
| 1 x 4 | * | * | * | * | * | * |
| 2 x 1 | * | * | * | * | * | * |
| 2 x 2 | * | * | * | * | * | * |
| 2 x 3 | * | * | * | * | * | * |
| 2 x 4 | * | * | * | * | * | * |
| Anxiety x Tension x Trial = 1 x 1 x 1 | -5.6667 | 3.3500 | -1.6916 | 0.1004 | -12.4903 | 1.1570 |
| 1 x 1 x 2 | -1.6667 | 3.3500 | -0.4975 | 0.6222 | -8.4903 | 5.1570 |
| 1 x 1 x 3 | -2.6667 | 3.3500 | -0.7960 | 0.4319 | -9.4903 | 4.1570 |
| 1 x 1 x 4 | * | * | * | * | * | * |
| 1 x 2 x 1 | * | * | * | * | * | * |
| 1 x 2 x 2 | * | * | * | * | * | * |
| 1 x 2 x 3 | * | * | * | * | * | * |
| 1 x 2 x 4 | * | * | * | * | * | * |
| 2 x 1 x 1 | * | * | * | * | * | * |
| 2 x 1 x 2 | * | * | * | * | * | * |
| 2 x 1 x 3 | * | * | * | * | * | * |
| 2 x 1 x 4 | * | * | * | * | * | * |
| 2 x 2 x 1 | * | * | * | * | * | * |
| 2 x 2 x 2 | * | * | * | * | * | * |
| 2 x 2 x 3 | * | * | * | * | * | * |
| 2 x 2 x 4 | * | * | * | * | * | * |
* omitted due to multicollinearity
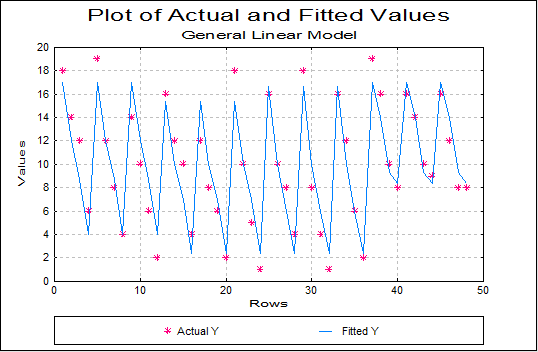
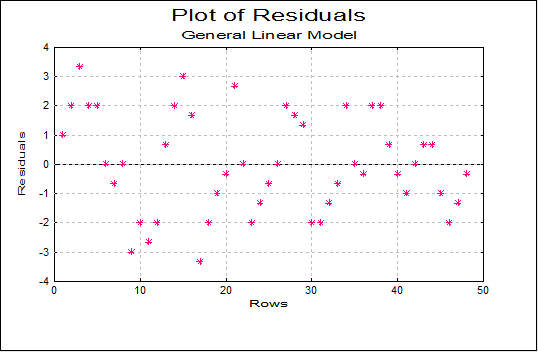
Case (Diagnostic) Statistics
| Actual Y | Fitted Y | Residuals | |
|---|---|---|---|
| 1 | 18.0000 | 17.0000 | 1.0000 |
| 2 | 14.0000 | 12.0000 | 2.0000 |
| 3 | 12.0000 | 8.6667 | 3.3333 |
| 4 | 6.0000 | 4.0000 | 2.0000 |
| 5 | 19.0000 | 17.0000 | 2.0000 |
| 6 | 12.0000 | 12.0000 | 0.0000 |
| 7 | 8.0000 | 8.6667 | -0.6667 |
| 8 | 4.0000 | 4.0000 | -0.0000 |
| 9 | 14.0000 | 17.0000 | -3.0000 |
| 10 | 10.0000 | 12.0000 | -2.0000 |
| 11 | 6.0000 | 8.6667 | -2.6667 |
| 12 | 2.0000 | 4.0000 | -2.0000 |
| 13 | 16.0000 | 15.3333 | 0.6667 |
| 14 | 12.0000 | 10.0000 | 2.0000 |
| 15 | 10.0000 | 7.0000 | 3.0000 |
| 16 | 4.0000 | 2.3333 | 1.6667 |
| 17 | 12.0000 | 15.3333 | -3.3333 |
| 18 | 8.0000 | 10.0000 | -2.0000 |
| 19 | 6.0000 | 7.0000 | -1.0000 |
| 20 | 2.0000 | 2.3333 | -0.3333 |
| 21 | 18.0000 | 15.3333 | 2.6667 |
| 22 | 10.0000 | 10.0000 | 0.0000 |
| 23 | 5.0000 | 7.0000 | -2.0000 |
| 24 | 1.0000 | 2.3333 | -1.3333 |
| 25 | 16.0000 | 16.6667 | -0.6667 |
| 26 | 10.0000 | 10.0000 | 0.0000 |
| 27 | 8.0000 | 6.0000 | 2.0000 |
| 28 | 4.0000 | 2.3333 | 1.6667 |
| 29 | 18.0000 | 16.6667 | 1.3333 |
| 30 | 8.0000 | 10.0000 | -2.0000 |
| 31 | 4.0000 | 6.0000 | -2.0000 |
| 32 | 1.0000 | 2.3333 | -1.3333 |
| 33 | 16.0000 | 16.6667 | -0.6667 |
| 34 | 12.0000 | 10.0000 | 2.0000 |
| 35 | 6.0000 | 6.0000 | 0.0000 |
| 36 | 2.0000 | 2.3333 | -0.3333 |
| 37 | 19.0000 | 17.0000 | 2.0000 |
| 38 | 16.0000 | 14.0000 | 2.0000 |
| 39 | 10.0000 | 9.3333 | 0.6667 |
| 40 | 8.0000 | 8.3333 | -0.3333 |
| 41 | 16.0000 | 17.0000 | -1.0000 |
| 42 | 14.0000 | 14.0000 | 0.0000 |
| 43 | 10.0000 | 9.3333 | 0.6667 |
| 44 | 9.0000 | 8.3333 | 0.6667 |
| 45 | 16.0000 | 17.0000 | -1.0000 |
| 46 | 12.0000 | 14.0000 | -2.0000 |
| 47 | 8.0000 | 9.3333 | -1.3333 |
| 48 | 8.0000 | 8.3333 | -0.3333 |
Student-Newman-Keuls
For Score, classified by Tension
Comparisons are between Least Squares Means.
Mean Square Error: 4.20833333333334, Degrees of Freedom: 32
** denotes significantly different pairs. Vertical bars show homogeneous subsets.
A pairwise test result is significant if its q stat value is greater than the table q.
| Group | Cases | Mean | 1 | 2 | |
|---|---|---|---|---|---|
| 1 | 24 | 9.5833 | | | ||
| 2 | 24 | 10.4167 | | |
| Comparison | Difference | Standard Error | q Stat | Table q | Probability | Lower 95% | Upper 95% | Result |
|---|---|---|---|---|---|---|---|---|
| 2 - 1 | 0.8333 | 0.5922 | 1.9901 | 2.8807 | 0.1690 | * | * |
| Homogeneous Subsets: | |
|---|---|
| Group 1: 1, 2 | |
| Pooled mean | 10.0000 |
| 95% Confidence Interval | 9.3969 <> 10.6031 |
Tukey-HSD
| Group | Cases | Mean | 1 | 2 | |
|---|---|---|---|---|---|
| 1 | 24 | 9.5833 | | | ||
| 2 | 24 | 10.4167 | | |
| Comparison | Difference | Standard Error | q Stat | Table q | Probability | Lower 95% | Upper 95% | Result |
|---|---|---|---|---|---|---|---|---|
| 2 - 1 | 0.8333 | 0.5922 | 1.9901 | 2.8807 | 0.1690 | -0.3729 | 2.0396 |
| Homogeneous Subsets: | |
|---|---|
| Group 1: 1, 2 | |
| Pooled mean | 10.0000 |
| 95% Confidence Interval | 9.3969 <> 10.6031 |
Tukey-B
| Group | Cases | Mean | 1 | 2 | |
|---|---|---|---|---|---|
| 1 | 24 | 9.5833 | | | ||
| 2 | 24 | 10.4167 | | |
| Comparison | Difference | Standard Error | q Stat | Table q | Probability | Lower 95% | Upper 95% | Result |
|---|---|---|---|---|---|---|---|---|
| 2 - 1 | 0.8333 | 0.5922 | 1.9901 | 2.8807 | 0.1690 | -0.3729 | 2.0396 |
| Homogeneous Subsets: | |
|---|---|
| Group 1: 1, 2 | |
| Pooled mean | 10.0000 |
| 95% Confidence Interval | 9.3969 <> 10.6031 |
Duncan
| Group | Cases | Mean | 1 | 2 | |
|---|---|---|---|---|---|
| 1 | 24 | 9.5833 | | | ||
| 2 | 24 | 10.4167 | | |
| Comparison | Difference | Standard Error | q Stat | Table q | Probability | Lower 95% | Upper 95% | Result |
|---|---|---|---|---|---|---|---|---|
| 2 - 1 | 0.8333 | 0.5922 | 1.9901 | 2.8792 | * | * | * |
| Homogeneous Subsets: | |
|---|---|
| Group 1: 1, 2 | |
| Pooled mean | 10.0000 |
| 95% Confidence Interval | 9.3969 <> 10.6031 |
Scheffe
| Group | Cases | Mean | 1 | 2 | |
|---|---|---|---|---|---|
| 1 | 24 | 9.5833 | | | ||
| 2 | 24 | 10.4167 | | |
| Comparison | Difference | Standard Error | q Stat | Table q | Probability | Lower 95% | Upper 95% | Result |
|---|---|---|---|---|---|---|---|---|
| 2 - 1 | 0.8333 | 0.5922 | 1.4072 | 2.0369 | 0.1690 | -0.3729 | 2.0396 |
| Homogeneous Subsets: | |
|---|---|
| Group 1: 1, 2 | |
| Pooled mean | 10.0000 |
| 95% Confidence Interval | 9.3969 <> 10.6031 |
Least Significant Difference (LSD)
| Group | Cases | Mean | 1 | 2 | |
|---|---|---|---|---|---|
| 1 | 24 | 9.5833 | | | ||
| 2 | 24 | 10.4167 | | |
| Comparison | Difference | Standard Error | q Stat | Table q | Probability | Lower 95% | Upper 95% | Result |
|---|---|---|---|---|---|---|---|---|
| 2 - 1 | 0.8333 | 0.5922 | 1.4072 | 2.0369 | 0.1661 | -0.3729 | 2.0396 |
| Homogeneous Subsets: | |
|---|---|
| Group 1: 1, 2 | |
| Pooled mean | 10.0000 |
| 95% Confidence Interval | 9.3969 <> 10.6031 |
Bonferroni (Modified LSD)
| Group | Cases | Mean | 1 | 2 | |
|---|---|---|---|---|---|
| 1 | 24 | 9.5833 | | | ||
| 2 | 24 | 10.4167 | | |
| Comparison | Difference | Standard Error | q Stat | Table q | Probability | Lower 95% | Upper 95% | Result |
|---|---|---|---|---|---|---|---|---|
| 2 - 1 | 0.8333 | 0.5922 | 1.4072 | 2.0369 | 0.1661 | -0.3729 | 2.0396 |
| Homogeneous Subsets: | |
|---|---|
| Group 1: 1, 2 | |
| Pooled mean | 10.0000 |
| 95% Confidence Interval | 9.3969 <> 10.6031 |
Dunnett
Control Group: 1, Two-Tailed Test
| Group | Cases | Mean | 1 | |
|---|---|---|---|---|
| 1 | 24 | 9.5833 | | | |
| 2 | 24 | 10.4167 | | |
| Comparison | Difference | Standard Error | q Stat | Table q | Probability | Lower 95% | Upper 95% | Result |
|---|---|---|---|---|---|---|---|---|
| 2 - 1 | 0.8333 | 0.5922 | 1.4072 | 2.0369 | 0.1690 | -0.3729 | 2.0396 |
| Homogeneous Subsets: | |
|---|---|
| Group 1: 1, 2 | |
| Pooled mean | 10.0000 |
| 95% Confidence Interval | 9.3969 <> 10.6031 |