Poisson Regression in Excel with UNISTAT
The UNISTAT statistics add-in extends Excel with Poisson Regression capabilities.
For further information visit UNISTAT User's Guide section 7.2.8. Poisson Regression.
Here we provide a sample output from the UNISTAT Excel statistics add-in for data analysis.
Poisson Regression
Dependent Variable: Number of cancers
Exposure: Subject-years
Valid Number of Cases: 22, 0 Omitted
Regression Results
| Coefficient | Standard Error | Wald Statistic | Probability | Lower 95% | Upper 95% | |
|---|---|---|---|---|---|---|
| Constant | -9.3284 | 0.2086 | 1999.7803 | 0.0000 | -9.7372 | -8.9195 |
| Status = Non-veteran | 0.0035 | 0.0555 | 0.0040 | 0.9493 | -0.1052 | 0.1123 |
| Age group = 25-29 | 0.6793 | 0.2325 | 8.5373 | 0.0035 | 0.2236 | 1.1350 |
| 30-34 | 1.3711 | 0.2177 | 39.6626 | 0.0000 | 0.9444 | 1.7978 |
| 35-39 | 1.9396 | 0.2121 | 83.6581 | 0.0000 | 1.5240 | 2.3553 |
| 40-44 | 2.0343 | 0.2161 | 88.6203 | 0.0000 | 1.6108 | 2.4579 |
| 45-49 | 2.7266 | 0.2222 | 150.5415 | 0.0000 | 2.2910 | 3.1621 |
| 50-54 | 3.2029 | 0.2206 | 210.7122 | 0.0000 | 2.7704 | 3.6353 |
| 55-59 | 3.7162 | 0.2178 | 291.1925 | 0.0000 | 3.2894 | 4.1430 |
| 60-64 | 4.0927 | 0.2177 | 353.4848 | 0.0000 | 3.6660 | 4.5193 |
| 65-69 | 4.2362 | 0.2242 | 356.9375 | 0.0000 | 3.7967 | 4.6757 |
| 70- | 4.3637 | 0.2274 | 368.3264 | 0.0000 | 3.9181 | 4.8094 |
Goodness of Fit Tests
| -2 Log likelihood | |
|---|---|
| Initial Model | 2199.7137 |
| Final Model | 132.0133 |
| Chi-Square Statistic | Degrees of Freedom | Right-Tail Probability | |
|---|---|---|---|
| Pearson | 5.2166 | 9 | 0.8150 |
| Likelihood Ratio | 2067.7004 | 11 | 0.0000 |
| Pseudo R-squared | |
|---|---|
| McFadden | 0.9400 |
| Adjusted McFadden | 0.9291 |
| Cox & Snell | 1.0000 |
| Nagelkerke | 1.0000 |
Correlation Matrix of Regression Coefficients
| Constant | Status = Non-veteran | Age group = 25-29 | 30-34 | 35-39 | 40-44 | 45-49 | 50-54 | |
|---|---|---|---|---|---|---|---|---|
| Constant | 1.0000 | -0.2060 | -0.8648 | -0.9241 | -0.9499 | -0.9362 | -0.9098 | -0.9133 |
| Status = Non-veteran | -0.2060 | 1.0000 | 0.0274 | 0.0319 | 0.0387 | 0.0575 | 0.0532 | 0.0388 |
| Age group = 25-29 | -0.8648 | 0.0274 | 1.0000 | 0.8241 | 0.8462 | 0.8309 | 0.8079 | 0.8133 |
| 30-34 | -0.9241 | 0.0319 | 0.8241 | 1.0000 | 0.9037 | 0.8875 | 0.8629 | 0.8686 |
| 35-39 | -0.9499 | 0.0387 | 0.8462 | 0.9037 | 1.0000 | 0.9115 | 0.8862 | 0.8920 |
| 40-44 | -0.9362 | 0.0575 | 0.8309 | 0.8875 | 0.9115 | 1.0000 | 0.8707 | 0.8761 |
| 45-49 | -0.9098 | 0.0532 | 0.8079 | 0.8629 | 0.8862 | 0.8707 | 1.0000 | 0.8518 |
| 50-54 | -0.9133 | 0.0388 | 0.8133 | 0.8686 | 0.8920 | 0.8761 | 0.8518 | 1.0000 |
| 55-59 | -0.9205 | 0.0159 | 0.8234 | 0.8793 | 0.9028 | 0.8863 | 0.8618 | 0.8678 |
| 60-64 | -0.9156 | -0.0096 | 0.8230 | 0.8789 | 0.9022 | 0.8852 | 0.8608 | 0.8671 |
| 65-69 | -0.8836 | -0.0353 | 0.7983 | 0.8524 | 0.8749 | 0.8579 | 0.8343 | 0.8408 |
| 70- | -0.8681 | -0.0504 | 0.7868 | 0.8401 | 0.8622 | 0.8451 | 0.8220 | 0.8286 |
| 55-59 | 60-64 | 65-69 | 70- | |||||
| Constant | -0.9205 | -0.9156 | -0.8836 | -0.8681 | ||||
| Status = Non-veteran | 0.0159 | -0.0096 | -0.0353 | -0.0504 | ||||
| Age group = 25-29 | 0.8234 | 0.8230 | 0.7983 | 0.7868 | ||||
| 30-34 | 0.8793 | 0.8789 | 0.8524 | 0.8401 | ||||
| 35-39 | 0.9028 | 0.9022 | 0.8749 | 0.8622 | ||||
| 40-44 | 0.8863 | 0.8852 | 0.8579 | 0.8451 | ||||
| 45-49 | 0.8618 | 0.8608 | 0.8343 | 0.8220 | ||||
| 50-54 | 0.8678 | 0.8671 | 0.8408 | 0.8286 | ||||
| 55-59 | 1.0000 | 0.8788 | 0.8527 | 0.8407 | ||||
| 60-64 | 0.8788 | 1.0000 | 0.8540 | 0.8423 | ||||
| 65-69 | 0.8527 | 0.8540 | 1.0000 | 0.8190 | ||||
| 70- | 0.8407 | 0.8423 | 0.8190 | 1.0000 |
Covariance Matrix of Regression Coefficients
| Constant | Status = Non-veteran | Age group = 25-29 | 30-34 | 35-39 | 40-44 | 45-49 | 50-54 | |
|---|---|---|---|---|---|---|---|---|
| Constant | 0.0435 | -0.0024 | -0.0419 | -0.0420 | -0.0420 | -0.0422 | -0.0422 | -0.0420 |
| Status = Non-veteran | -0.0024 | 0.0031 | 0.0004 | 0.0004 | 0.0005 | 0.0007 | 0.0007 | 0.0005 |
| Age group = 25-29 | -0.0419 | 0.0004 | 0.0541 | 0.0417 | 0.0417 | 0.0417 | 0.0417 | 0.0417 |
| 30-34 | -0.0420 | 0.0004 | 0.0417 | 0.0474 | 0.0417 | 0.0418 | 0.0417 | 0.0417 |
| 35-39 | -0.0420 | 0.0005 | 0.0417 | 0.0417 | 0.0450 | 0.0418 | 0.0418 | 0.0417 |
| 40-44 | -0.0422 | 0.0007 | 0.0417 | 0.0418 | 0.0418 | 0.0467 | 0.0418 | 0.0418 |
| 45-49 | -0.0422 | 0.0007 | 0.0417 | 0.0417 | 0.0418 | 0.0418 | 0.0494 | 0.0418 |
| 50-54 | -0.0420 | 0.0005 | 0.0417 | 0.0417 | 0.0417 | 0.0418 | 0.0418 | 0.0487 |
| 55-59 | -0.0418 | 0.0002 | 0.0417 | 0.0417 | 0.0417 | 0.0417 | 0.0417 | 0.0417 |
| 60-64 | -0.0416 | -0.0001 | 0.0417 | 0.0417 | 0.0416 | 0.0416 | 0.0416 | 0.0416 |
| 65-69 | -0.0413 | -0.0004 | 0.0416 | 0.0416 | 0.0416 | 0.0416 | 0.0416 | 0.0416 |
| 70- | -0.0412 | -0.0006 | 0.0416 | 0.0416 | 0.0416 | 0.0415 | 0.0415 | 0.0416 |
| 55-59 | 60-64 | 65-69 | 70- | |||||
| Constant | -0.0418 | -0.0416 | -0.0413 | -0.0412 | ||||
| Status = Non-veteran | 0.0002 | -0.0001 | -0.0004 | -0.0006 | ||||
| Age group = 25-29 | 0.0417 | 0.0417 | 0.0416 | 0.0416 | ||||
| 30-34 | 0.0417 | 0.0417 | 0.0416 | 0.0416 | ||||
| 35-39 | 0.0417 | 0.0416 | 0.0416 | 0.0416 | ||||
| 40-44 | 0.0417 | 0.0416 | 0.0416 | 0.0415 | ||||
| 45-49 | 0.0417 | 0.0416 | 0.0416 | 0.0415 | ||||
| 50-54 | 0.0417 | 0.0416 | 0.0416 | 0.0416 | ||||
| 55-59 | 0.0474 | 0.0417 | 0.0416 | 0.0416 | ||||
| 60-64 | 0.0417 | 0.0474 | 0.0417 | 0.0417 | ||||
| 65-69 | 0.0416 | 0.0417 | 0.0503 | 0.0418 | ||||
| 70- | 0.0416 | 0.0417 | 0.0418 | 0.0517 |
Incidence Rate Ratio
| Incidence Rate Ratio | Standard Error | Lower 95% | Upper 95% | |
|---|---|---|---|---|
| Status = Non-veteran | 1.0035 | 0.0557 | 0.9001 | 1.1188 |
| Age group = 25-29 | 1.9725 | 0.4586 | 1.2506 | 3.1111 |
| 30-34 | 3.9396 | 0.8577 | 2.5712 | 6.0363 |
| 35-39 | 6.9561 | 1.4751 | 4.5905 | 10.5408 |
| 40-44 | 7.6471 | 1.6525 | 5.0067 | 11.6799 |
| 45-49 | 15.2801 | 3.3956 | 9.8849 | 23.6201 |
| 50-54 | 24.6031 | 5.4286 | 15.9653 | 37.9144 |
| 55-59 | 41.1074 | 8.9521 | 26.8256 | 62.9927 |
| 60-64 | 59.9000 | 13.0391 | 39.0963 | 91.7736 |
| 65-69 | 69.1453 | 15.5040 | 44.5557 | 107.3055 |
| 70- | 78.5486 | 17.8599 | 50.3034 | 122.6533 |
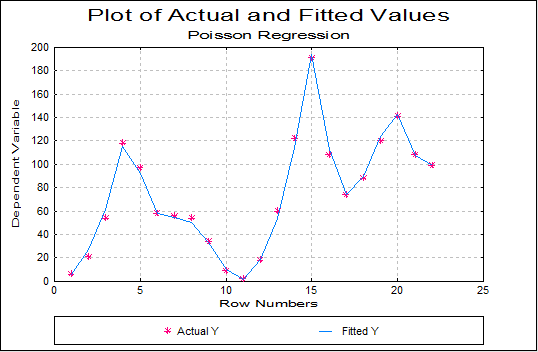
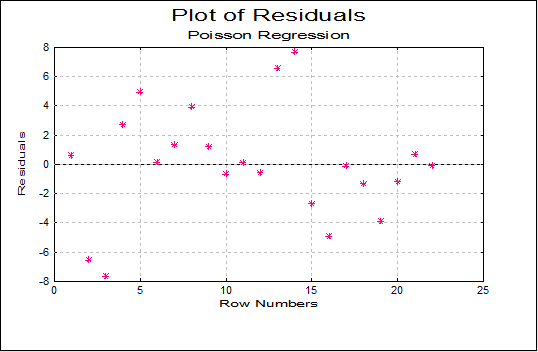
Case (Diagnostic) Statistics
| Actual Y | Fitted Y | 95% lb Actual Y | 95% ub Actual Y | Standard Error of Fitted | Deviance | Residuals | Standardised Residuals | |
|---|---|---|---|---|---|---|---|---|
| 1 | 6.0000 | 5.4067 | 4.9979 | 5.8156 | 0.2086 | 0.0628 | 0.5933 | 0.2551 |
| 2 | 21.0000 | 27.5518 | 27.3225 | 27.7811 | 0.1170 | 1.6987 | -6.5518 | -1.2482 |
| 3 | 54.0000 | 61.6656 | 61.5018 | 61.8293 | 0.0836 | 0.9950 | -7.6656 | -0.9762 |
| 4 | 118.0000 | 115.2981 | 115.1674 | 115.4288 | 0.0667 | 0.0628 | 2.7019 | 0.2516 |
| 5 | 97.0000 | 92.0660 | 91.9166 | 92.2154 | 0.0762 | 0.2598 | 4.9340 | 0.5142 |
| 6 | 58.0000 | 57.8741 | 57.6929 | 58.0553 | 0.0924 | 0.0003 | 0.1259 | 0.0165 |
| 7 | 56.0000 | 54.6629 | 54.4862 | 54.8396 | 0.0902 | 0.0324 | 1.3371 | 0.1809 |
| 8 | 54.0000 | 50.0844 | 49.9168 | 50.2519 | 0.0855 | 0.2984 | 3.9156 | 0.5533 |
| 9 | 34.0000 | 32.8068 | 32.6343 | 32.9793 | 0.0880 | 0.0429 | 1.1932 | 0.2083 |
| 10 | 9.0000 | 9.6781 | 9.4712 | 9.8849 | 0.1055 | 0.0487 | -0.6781 | -0.2180 |
| 11 | 2.0000 | 1.9057 | 1.6834 | 2.1280 | 0.1134 | 0.0046 | 0.0943 | 0.0683 |
| 12 | 18.0000 | 18.5933 | 18.1925 | 18.9941 | 0.2045 | 0.0191 | -0.5933 | -0.1376 |
| 13 | 60.0000 | 53.4481 | 53.2272 | 53.6690 | 0.1127 | 0.7722 | 6.5519 | 0.8962 |
| 14 | 122.0000 | 114.3345 | 114.1819 | 114.4871 | 0.0778 | 0.5028 | 7.6655 | 0.7169 |
| 15 | 191.0000 | 193.7020 | 193.5833 | 193.8206 | 0.0605 | 0.0379 | -2.7020 | -0.1941 |
| 16 | 108.0000 | 112.9340 | 112.7887 | 113.0793 | 0.0742 | 0.2188 | -4.9340 | -0.4643 |
| 17 | 74.0000 | 74.1259 | 73.9488 | 74.3030 | 0.0904 | 0.0002 | -0.1259 | -0.0146 |
| 18 | 88.0000 | 89.3372 | 89.1687 | 89.5056 | 0.0860 | 0.0201 | -1.3372 | -0.1415 |
| 19 | 120.0000 | 123.9157 | 123.7638 | 124.0675 | 0.0775 | 0.1251 | -3.9157 | -0.3518 |
| 20 | 141.0000 | 142.1933 | 142.0437 | 142.3428 | 0.0763 | 0.0100 | -1.1933 | -0.1001 |
| 21 | 108.0000 | 107.3219 | 107.1405 | 107.5034 | 0.0926 | 0.0043 | 0.6781 | 0.0655 |
| 22 | 99.0000 | 99.0944 | 98.8993 | 99.2894 | 0.0995 | 0.0001 | -0.0944 | -0.0095 |