Nonlinear Regression in Excel with UNISTAT
The UNISTAT statistics add-in extends Excel with Nonlinear Regression capabilities.
For further information visit UNISTAT User's Guide section 7.2.4. Nonlinear Regression.
Here we provide a sample output from the UNISTAT Excel statistics add-in for data analysis.
Nonlinear Regression
Regression Results
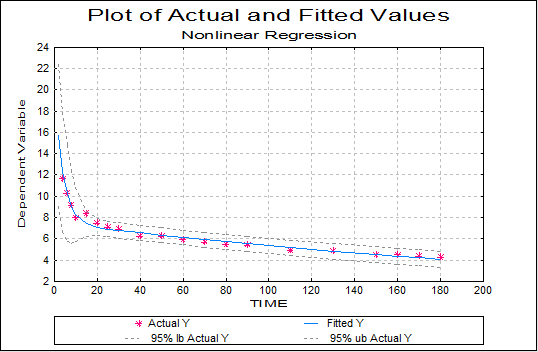
EXAMPLE 2: BIPHASIC EXPONENTIAL DECAY
ACTIVITY = INIT1*EXP(RATE1*TIME)+INIT2*EXP(RATE2*TIME)
Convergence achieved at iteration 11, Number of halving = 0
Goodness of Fit: OK
| Parameter | Minimum | Maximum | Estimate | Standard Error | Status | Lower 95% | Upper 95% |
|---|---|---|---|---|---|---|---|
| INIT1 | 14.0304 | 1.5996 | Free | 10.6554 | 17.4053 | ||
| RATE1 | -0.2627 | 0.0320 | Free | -0.3303 | -0.1952 | ||
| INIT2 | 7.4943 | 0.1836 | Free | 7.1071 | 7.8816 | ||
| RATE2 | -0.0034 | 0.0002 | Free | -0.0039 | -0.0029 |
| With normalised weights: | |
|---|---|
| Residual Sum of Squares | 1.4317 |
| Root Mean Square Error | 0.2902 |
| With absolute weights: | |
| Residual Sum of Squares | 40.0617 |
| Root Mean Square Error | 1.5351 |
| Number of Parameters | 4 |
| Number of Active Parameters | 4 |
| Number of Cases | 21 |
| Degrees of Freedom | 17 |
| R-squared | 0.9863 |
| Durbin-Watson Statistic | 0.8836 |
ANOVA of Regression
| Due To | Sum of Squares | DoF | Mean Square | F-Stat | Prob |
|---|---|---|---|---|---|
| Regression | 71.009 | 3 | 23.670 | 281.046 | 0.0000 |
| Error | 1.432 | 17 | 0.084 | ||
| Total | 72.441 | 20 | 3.622 |
Correlation Matrix of Regression Coefficients
| 1 | 2 | 3 | 4 | |
|---|---|---|---|---|
| 1 | 1.0000 | -0.8176 | 0.1491 | -0.1165 |
| 2 | -0.8176 | 1.0000 | -0.4890 | 0.4037 |
| 3 | 0.1491 | -0.4890 | 1.0000 | -0.8597 |
| 4 | -0.1165 | 0.4037 | -0.8597 | 1.0000 |
Covariance Matrix of Regression Coefficients
| 1 | 2 | 3 | 4 | |
|---|---|---|---|---|
| 1 | 2.5589 | -0.0419 | 0.0438 | -0.0000 |
| 2 | -0.0419 | 0.0010 | -0.0029 | 0.0000 |
| 3 | 0.0438 | -0.0029 | 0.0337 | -0.0000 |
| 4 | -0.0000 | 0.0000 | -0.0000 | 0.0000 |
Case (Diagnostic) Statistics
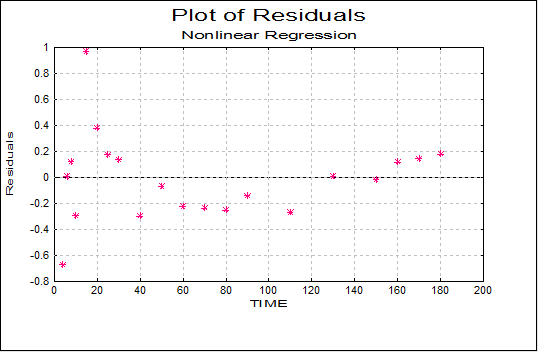
| Actual Y | Fitted Y | 95% lb Actual Y | 95% ub Actual Y | Standard Error of Fitted | Residuals | |
|---|---|---|---|---|---|---|
| 1 | 16.2034 | 15.7396 | 9.0704 | 22.4088 | 0.5249 | 0.4638 |
| 2 | 11.6254 | 12.2986 | 6.6993 | 17.8980 | 0.4407 | -0.6732 |
| 3 | 10.2491 | 10.2439 | 5.7365 | 14.7512 | 0.3547 | 0.0052 |
| 4 | 9.1293 | 9.0089 | 5.5651 | 12.4527 | 0.2710 | 0.1204 |
| 5 | 7.9613 | 8.2587 | 5.7141 | 10.8034 | 0.2003 | -0.2974 |
| 6 | 8.3625 | 7.3957 | 6.1907 | 8.6007 | 0.0948 | 0.9668 |
| 7 | 7.4554 | 7.0768 | 6.2817 | 7.8719 | 0.0626 | 0.3786 |
| 8 | 7.0782 | 6.9056 | 6.1852 | 7.6260 | 0.0567 | 0.1726 |
| 9 | 6.9105 | 6.7756 | 6.0686 | 7.4826 | 0.0556 | 0.1349 |
| 10 | 6.2450 | 6.5452 | 5.8463 | 7.2441 | 0.0550 | -0.3002 |
| 11 | 6.2566 | 6.3269 | 5.6315 | 7.0223 | 0.0547 | -0.0703 |
| 12 | 5.8914 | 6.1162 | 5.4212 | 6.8111 | 0.0547 | -0.2248 |
| 13 | 5.6744 | 5.9125 | 5.2157 | 6.6093 | 0.0548 | -0.2381 |
| 14 | 5.4640 | 5.7156 | 5.0151 | 6.4161 | 0.0551 | -0.2516 |
| 15 | 5.3833 | 5.5253 | 4.8198 | 6.2308 | 0.0555 | -0.1420 |
| 16 | 4.8935 | 5.1634 | 4.4457 | 5.8811 | 0.0565 | -0.2699 |
| 17 | 4.8322 | 4.8252 | 4.0944 | 5.5561 | 0.0575 | 0.0070 |
| 18 | 4.4895 | 4.5092 | 3.7661 | 5.2524 | 0.0585 | -0.0197 |
| 19 | 4.4750 | 4.3591 | 3.6104 | 5.1078 | 0.0589 | 0.1159 |
| 20 | 4.3560 | 4.2139 | 3.4602 | 4.9676 | 0.0593 | 0.1421 |
| 21 | 4.2515 | 4.0736 | 3.3155 | 4.8316 | 0.0597 | 0.1779 |