Polynomial Regression in Excel with UNISTAT
The UNISTAT statistics add-in extends Excel with Polynomial Regression capabilities.
For further information visit UNISTAT User's Guide section 7.2.2. Polynomial Regression.
Here we provide a sample output from the UNISTAT Excel statistics add-in for data analysis.
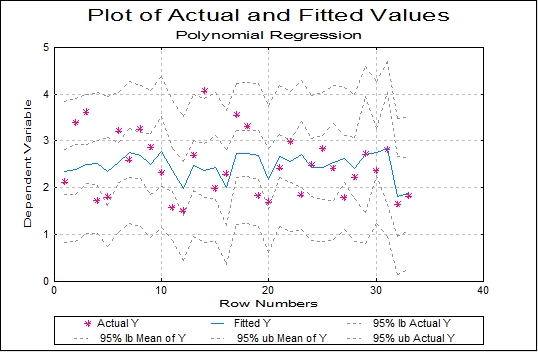
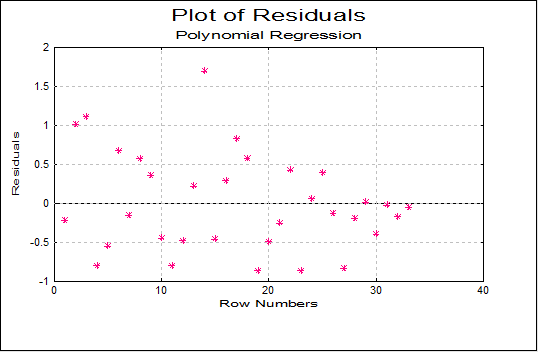
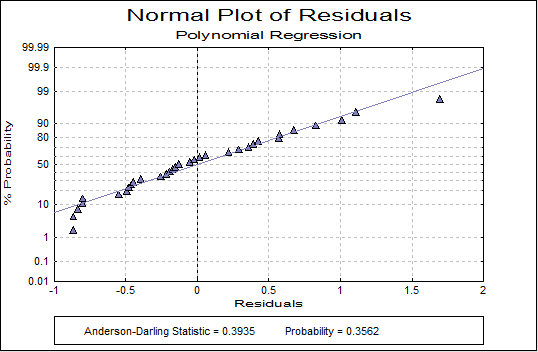
Polynomial Regression
Dependent Variable: ml
Valid Number of Cases: 33, 0 Omitted
Regression Results
| Coefficient | Standard Error | t-Statistic | Probability | Lower 95% | Upper 95% | |
|---|---|---|---|---|---|---|
| Constant | -46.8884 | 38.6993 | -1.2116 | 0.2366 | -126.4360 | 32.6592 |
| cm^1 | 15.8446 | 12.3077 | 1.2874 | 0.2093 | -9.4543 | 41.1436 |
| cm^2 | -1.5529 | 1.3422 | -1.1570 | 0.2578 | -4.3119 | 1.2060 |
| cm^3 | 0.0539 | 0.0475 | 1.1341 | 0.2671 | -0.0438 | 0.1515 |
| mm^3 | 0.0464 | 0.1202 | 0.3856 | 0.7030 | -0.2008 | 0.2935 |
| mm^4 | -0.0037 | 0.0132 | -0.2795 | 0.7821 | -0.0308 | 0.0234 |
| cm x mm | -0.2194 | 0.2598 | -0.8445 | 0.4061 | -0.7535 | 0.3147 |
| Residual Sum of Squares | 12.5474 |
|---|---|
| Standard Error | 0.6947 |
| Mean of Y | 2.4742 |
| Standard Deviation of Y | 0.6789 |
| Correlation Coefficient | 0.3862 |
| R-squared | 0.1492 |
| Adjusted R-squared | -0.0472 |
| F(6,26) | 0.7597 |
| Probability of F | 0.6079 |
| Durbin-Watson Statistic | 1.9130 |
| Log of Likelihood | -31.3034 |
| Press Statistic | 17.5842 |
ANOVA of Regression
| Due To | Sum of Squares | DoF | Mean Square | F-Stat | Prob |
|---|---|---|---|---|---|
| cm^1 | 0.663 | 1 | 0.663 | 1.374 | 0.2518 |
| cm^2 | 0.096 | 1 | 0.096 | 0.198 | 0.6601 |
| cm^3 | 0.950 | 1 | 0.950 | 1.969 | 0.1724 |
| mm^3 | 0.088 | 1 | 0.088 | 0.182 | 0.6731 |
| mm^4 | 0.059 | 1 | 0.059 | 0.122 | 0.7294 |
| cm x mm | 0.344 | 1 | 0.344 | 0.713 | 0.4061 |
| Regression | 2.200 | 6 | 0.367 | 0.760 | 0.6079 |
| Error | 12.547 | 26 | 0.483 | ||
| Total | 14.747 | 32 | 0.461 | 0.955 | 0.5539 |