Slope Ratio Method in Excel with UNISTAT
The UNISTAT statistics add-in extends Excel with Slope Ratio Method capabilities.
For further information visit UNISTAT User's Guide section 10.2. Slope Ratio Method.
Here we provide a sample output from the UNISTAT Excel statistics add-in for data analysis.
Slope Ratio Method
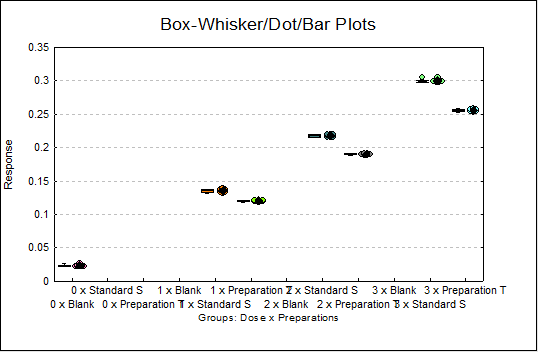
Summary Statistics
Data variable: Response
Subsample selected by: Dose x Preparations
Quantile Method: Simple Average
| Valid Cases | Mean | Median | Variance | |
|---|---|---|---|---|
| 0 x Blank | 8 | 0.0232 | 0.0230 | 0.0000 |
| 0 x Standard S | 0 | * | * | * |
| 0 x Preparation T | 0 | * | * | * |
| 1 x Blank | 0 | * | * | * |
| 1 x Standard S | 8 | 0.1351 | 0.1360 | 0.0000 |
| 1 x Preparation T | 8 | 0.1200 | 0.1200 | 0.0000 |
| 2 x Blank | 0 | * | * | * |
| 2 x Standard S | 8 | 0.2176 | 0.2180 | 0.0000 |
| 2 x Preparation T | 8 | 0.1897 | 0.1900 | 0.0000 |
| 3 x Blank | 0 | * | * | * |
| 3 x Standard S | 8 | 0.2996 | 0.2990 | 0.0000 |
| 3 x Preparation T | 8 | 0.2554 | 0.2550 | 0.0000 |
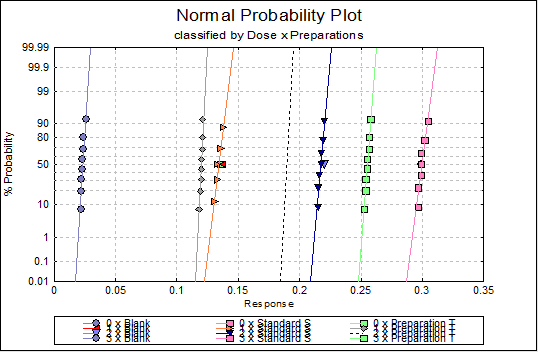
Shapiro-Wilk Normality Test
Alpha = 0.05
| Dose x Preparations | Test Statistic | Probability | Pass/Fail |
|---|---|---|---|
| 0 x Blank | 0.8578 | 0.1143 | Pass |
| 1 x Standard S | 0.8969 | 0.2707 | Pass |
| 2 x Standard S | 0.8816 | 0.1952 | Pass |
| 3 x Standard S | 0.8269 | 0.0551 | Pass |
| 1 x Preparation T | 0.8599 | 0.1199 | Pass |
| 2 x Preparation T | 0.8042 | 0.0318 | **Fail** |
| 3 x Preparation T | 0.9255 | 0.4763 | Pass |
Kolmogorov-Smirnov Normality Test
Alpha = 0.05
| Dose x Preparations | Test Statistic | * Probability | Pass/Fail |
|---|---|---|---|
| 0 x Blank | 0.1964 | 0.2000 | Pass |
| 1 x Standard S | 0.2632 | 0.1076 | Pass |
| 2 x Standard S | 0.1970 | 0.2000 | Pass |
| 3 x Standard S | 0.3426 | 0.0063 | **Fail** |
| 1 x Preparation T | 0.2500 | 0.1494 | Pass |
| 2 x Preparation T | 0.3350 | 0.0086 | **Fail** |
| 3 x Preparation T | 0.2090 | 0.2000 | Pass |
* Lilliefors probability = 0.2 means 0.2 or greater.
Cramer-von Mises Normality Test
Alpha = 0.05
| Dose x Preparations | Test Statistic | Probability | Pass/Fail |
|---|---|---|---|
| 0 x Blank | 0.0730 | 0.2229 | Pass |
| 1 x Standard S | 0.0832 | 0.1615 | Pass |
| 2 x Standard S | 0.0582 | 0.3577 | Pass |
| 3 x Standard S | 0.1351 | 0.0290 | **Fail** |
| 1 x Preparation T | 0.0863 | 0.1464 | Pass |
| 2 x Preparation T | 0.1404 | 0.0244 | **Fail** |
| 3 x Preparation T | 0.0608 | 0.3289 | Pass |
Anderson-Darling Normality Test
Alpha = 0.05
| Dose x Preparations | Test Statistic | Probability | Pass/Fail |
|---|---|---|---|
| 0 x Blank | 0.4909 | 0.1530 | Pass |
| 1 x Standard S | 0.4529 | 0.1958 | Pass |
| 2 x Standard S | 0.3924 | 0.2868 | Pass |
| 3 x Standard S | 0.6980 | 0.0410 | **Fail** |
| 1 x Preparation T | 0.5178 | 0.1280 | Pass |
| 2 x Preparation T | 0.7702 | 0.0258 | **Fail** |
| 3 x Preparation T | 0.3484 | 0.3758 | Pass |
Homogeneity of Variance Tests
For 7 groups defined by Dose x Preparations.
Alpha = 0.05
| Test Statistic | Probability | Pass/Fail | |
|---|---|---|---|
| Bartlett’s Chi-square Test | 9.7490 | 0.1356 | Pass |
| Bartlett-Box F Test | 1.6372 | 0.1327 | Pass |
| Cochran’s C (max var / sum var) | 0.2842 | 0.2667 | Pass |
| Hartley’s F (max var / min var) | 6.2344 | * | |
| Levene’s F Test | 2.2108 | 0.0576 | Pass |
Dixon’s Outlier Test
Alpha = 0.05
One-tailed tests
| Dose x Preparations | Dixon’s Q | Table Q | Pass/Fail |
|---|---|---|---|
| 0 x Blank Q(Min) | 0.0000 | 0.5540 | Pass |
| Q(Max) | 0.5000 | 0.5540 | Pass |
| 1 x Standard S Q(Min) | 0.3333 | 0.5540 | Pass |
| Q(Max) | 0.2000 | 0.5540 | Pass |
| 2 x Standard S Q(Min) | 0.0000 | 0.5540 | Pass |
| Q(Max) | 0.0000 | 0.5540 | Pass |
| 3 x Standard S Q(Min) | 0.0000 | 0.5540 | Pass |
| Q(Max) | 0.3750 | 0.5540 | Pass |
| 1 x Preparation T Q(Min) | 0.3333 | 0.5540 | Pass |
| Q(Max) | 0.0000 | 0.5540 | Pass |
| 2 x Preparation T Q(Min) | 0.0000 | 0.5540 | Pass |
| Q(Max) | 0.0000 | 0.5540 | Pass |
| 3 x Preparation T Q(Min) | 0.2500 | 0.5540 | Pass |
| Q(Max) | 0.2500 | 0.5540 | Pass |
N = 8, Q(Min)=(X(2)-X(1))/(X(N-1)-X(1)), Q(Max)=(X(N)-X(N-1))/(X(N)-X(2))
Grubbs’ Outlier Test
Alpha = 0.05
One-tailed tests
| Dose x Preparations | Grubbs’ G | Table G | Pass/Fail |
|---|---|---|---|
| 0 x Blank G(Min) | 0.9001 | 2.0317 | Pass |
| G(Max) | 1.9802 | 2.0317 | Pass |
| 1 x Standard S G(Min) | 1.6668 | 2.0317 | Pass |
| G(Max) | 1.1617 | 2.0317 | Pass |
| 2 x Standard S G(Min) | 1.2706 | 2.0317 | Pass |
| G(Max) | 1.1496 | 2.0317 | Pass |
| 3 x Standard S G(Min) | 0.9834 | 2.0317 | Pass |
| G(Max) | 2.0137 | 2.0317 | Pass |
| 1 x Preparation T G(Min) | 1.8708 | 2.0317 | Pass |
| G(Max) | 0.9354 | 2.0317 | Pass |
| 2 x Preparation T G(Min) | 1.5022 | 2.0317 | Pass |
| G(Max) | 1.0730 | 2.0317 | Pass |
| 3 x Preparation T G(Min) | 1.3435 | 2.0317 | Pass |
| G(Max) | 1.4849 | 2.0317 | Pass |
G = Maximum deviation from mean / Standard Deviation
ESD Outlier Test
Alpha = 0.05
Two-tailed test
Number of outliers to test (ESD) = 2
| Dose x Preparations | ESD Ri | Table Ri | Pass/Fail |
|---|---|---|---|
| 0 x Blank (Max) 1 | 1.9802 | 2.1266 | Pass |
| 0 x Blank (Max) 2 | 1.2702 | 2.0200 | Pass |
| 1 x Standard S (Min) 1 | 1.6668 | 2.1266 | Pass |
| 1 x Standard S (Min) 2 | 1.3736 | 2.0200 | Pass |
| 2 x Standard S (Min) 1 | 1.2706 | 2.1266 | Pass |
| 2 x Standard S (Min) 2 | 1.5667 | 2.0200 | Pass |
| 3 x Standard S (Max) 1 | 2.0137 | 2.1266 | Pass |
| 3 x Standard S (Max) 2 | 1.8750 | 2.0200 | Pass |
| 1 x Preparation T (Min) 1 | 1.8708 | 2.1266 | Pass |
| 1 x Preparation T (Min) 2 | 1.7008 | 2.0200 | Pass |
| 2 x Preparation T (Min) 1 | 1.5022 | 2.1266 | Pass |
| 2 x Preparation T (Min) 2 | 2.0000 | 2.0200 | Pass |
| 3 x Preparation T (Max) 1 | 1.4849 | 2.1266 | Pass |
| 3 x Preparation T (Min) 2 | 1.3093 | 2.0200 | Pass |
Ri = Generalised Extreme Studentised Deviate
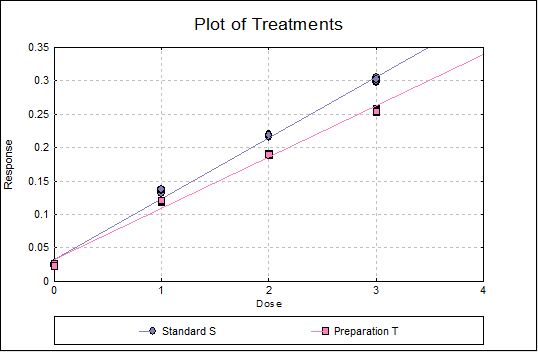
Separate Regression
| Intercept | Slope | R-squared | Pass/Fail | |
|---|---|---|---|---|
| Standard S | 0.0530 | 0.0822 | 0.9989 | Pass |
| Preparation T | 0.0530 | 0.0677 | 0.9992 | Pass |
Common Regression
| Intercept | Slope | R-squared | Pass/Fail | |
|---|---|---|---|---|
| Standard S | 0.0370 | 0.0891 | 0.9916 | Pass |
| Preparation T | 0.0746 |
| Residual Variance | 0.0187 |
|---|---|
| Degrees of Freedom | 53 |
Case (Diagnostic) Statistics
| Response | Dose | Preparations | Estimated Response | Residuals | Standardised Residuals | |
|---|---|---|---|---|---|---|
| 1 | 0.022 | 0 | Blank | 0.0370 | -0.0150 | -1.8524 |
| 2 | 0.024 | 0 | Blank | 0.0370 | -0.0130 | -1.6049 |
| 3 | 0.024 | 0 | Blank | 0.0370 | -0.0130 | -1.6049 |
| 4 | 0.026 | 0 | Blank | 0.0370 | -0.0110 | -1.3575 |
| 5 | 0.023 | 0 | Blank | 0.0370 | -0.0140 | -1.7287 |
| 6 | 0.022 | 0 | Blank | 0.0370 | -0.0150 | -1.8524 |
| 7 | 0.022 | 0 | Blank | 0.0370 | -0.0150 | -1.8524 |
| 8 | 0.023 | 0 | Blank | 0.0370 | -0.0140 | -1.7287 |
| 9 | 0.133 | 1 | Standard S | 0.1261 | 0.0069 | 0.8571 |
| 10 | 0.133 | 1 | Standard S | 0.1261 | 0.0069 | 0.8571 |
| 11 | 0.131 | 1 | Standard S | 0.1261 | 0.0049 | 0.6097 |
| 12 | 0.136 | 1 | Standard S | 0.1261 | 0.0099 | 1.2283 |
| 13 | 0.137 | 1 | Standard S | 0.1261 | 0.0109 | 1.3520 |
| 14 | 0.136 | 1 | Standard S | 0.1261 | 0.0099 | 1.2283 |
| 15 | 0.138 | 1 | Standard S | 0.1261 | 0.0119 | 1.4758 |
| 16 | 0.137 | 1 | Standard S | 0.1261 | 0.0109 | 1.3520 |
| 17 | 0.215 | 2 | Standard S | 0.2152 | -0.0002 | -0.0216 |
| 18 | 0.215 | 2 | Standard S | 0.2152 | -0.0002 | -0.0216 |
| 19 | 0.216 | 2 | Standard S | 0.2152 | 0.0008 | 0.1021 |
| 20 | 0.218 | 2 | Standard S | 0.2152 | 0.0028 | 0.3496 |
| 21 | 0.22 | 2 | Standard S | 0.2152 | 0.0048 | 0.5971 |
| 22 | 0.22 | 2 | Standard S | 0.2152 | 0.0048 | 0.5971 |
| 23 | 0.219 | 2 | Standard S | 0.2152 | 0.0038 | 0.4733 |
| 24 | 0.218 | 2 | Standard S | 0.2152 | 0.0028 | 0.3496 |
| 25 | 0.299 | 3 | Standard S | 0.3043 | -0.0053 | -0.6528 |
| 26 | 0.299 | 3 | Standard S | 0.3043 | -0.0053 | -0.6528 |
| 27 | 0.299 | 3 | Standard S | 0.3043 | -0.0053 | -0.6528 |
| 28 | 0.297 | 3 | Standard S | 0.3043 | -0.0073 | -0.9003 |
| 29 | 0.297 | 3 | Standard S | 0.3043 | -0.0073 | -0.9003 |
| 30 | 0.305 | 3 | Standard S | 0.3043 | 0.0007 | 0.0896 |
| 31 | 0.299 | 3 | Standard S | 0.3043 | -0.0053 | -0.6528 |
| 32 | 0.302 | 3 | Standard S | 0.3043 | -0.0023 | -0.2816 |
| 33 | 0.12 | 1 | Preparation T | 0.1115 | 0.0085 | 1.0482 |
| 34 | 0.119 | 1 | Preparation T | 0.1115 | 0.0075 | 0.9245 |
| 35 | 0.118 | 1 | Preparation T | 0.1115 | 0.0065 | 0.8008 |
| 36 | 0.12 | 1 | Preparation T | 0.1115 | 0.0085 | 1.0482 |
| 37 | 0.12 | 1 | Preparation T | 0.1115 | 0.0085 | 1.0482 |
| 38 | 0.121 | 1 | Preparation T | 0.1115 | 0.0095 | 1.1720 |
| 39 | 0.121 | 1 | Preparation T | 0.1115 | 0.0095 | 1.1720 |
| 40 | 0.121 | 1 | Preparation T | 0.1115 | 0.0095 | 1.1720 |
| 41 | 0.188 | 2 | Preparation T | 0.1861 | 0.0019 | 0.2369 |
| 42 | 0.188 | 2 | Preparation T | 0.1861 | 0.0019 | 0.2369 |
| 43 | 0.19 | 2 | Preparation T | 0.1861 | 0.0039 | 0.4844 |
| 44 | 0.19 | 2 | Preparation T | 0.1861 | 0.0039 | 0.4844 |
| 45 | 0.19 | 2 | Preparation T | 0.1861 | 0.0039 | 0.4844 |
| 46 | 0.191 | 2 | Preparation T | 0.1861 | 0.0049 | 0.6081 |
| 47 | 0.191 | 2 | Preparation T | 0.1861 | 0.0049 | 0.6081 |
| 48 | 0.19 | 2 | Preparation T | 0.1861 | 0.0039 | 0.4844 |
| 49 | 0.254 | 3 | Preparation T | 0.2606 | -0.0066 | -0.8218 |
| 50 | 0.253 | 3 | Preparation T | 0.2606 | -0.0076 | -0.9456 |
| 51 | 0.255 | 3 | Preparation T | 0.2606 | -0.0056 | -0.6981 |
| 52 | 0.258 | 3 | Preparation T | 0.2606 | -0.0026 | -0.3269 |
| 53 | 0.257 | 3 | Preparation T | 0.2606 | -0.0036 | -0.4507 |
| 54 | 0.257 | 3 | Preparation T | 0.2606 | -0.0036 | -0.4507 |
| 55 | 0.255 | 3 | Preparation T | 0.2606 | -0.0056 | -0.6981 |
| 56 | 0.254 | 3 | Preparation T | 0.2606 | -0.0066 | -0.8218 |
Validity of Assay
| Due To | Sum of Squares | DoF | Mean Square | F-Stat | Prob | Pass/Fail |
|---|---|---|---|---|---|---|
| Constant | 1.759 | 1 | 1.759 | |||
| Regression | 0.410 | 2 | 0.205 | 57206.122 | 0.0000 | Pass |
| Blanks | 0.003 | 1 | 0.003 | 911.134 | 0.0000 | Pass |
| Intercept | 0.000 | 1 | 0.000 | 0.001 | 0.9771 | **Fail** |
| Non-linearity | 0.000 | 2 | 0.000 | 3.214 | 0.0488 | **Fail** |
| Standard S Non-linearity | 0.000 | 1 | 0.000 | 0.093 | 0.7616 | |
| Preparation T Non-linearity | 0.000 | 1 | 0.000 | 6.334 | 0.0152 | |
| Treatments | 0.413 | 6 | 0.069 | |||
| Residual | 0.000 | 49 | 0.000 | |||
| Total | 0.413 | 55 | 0.008 |
Potency
| Estimated Potency | Lower 95% | Upper 95% | DoF | |
|---|---|---|---|---|
| Preparation T | 0.8368 | 0.8315 | 0.8421 | 49 |
| Relative Potency | Lower 95% | Upper 95% | |
|---|---|---|---|
| Preparation T | 83.68% | 83.15% | 84.21% |
| Percent CI | Lower 95% | Upper 95% | |
|---|---|---|---|
| Preparation T | 100.00% | 99.37% | 100.64% |
| G | 0.0000 |
|---|---|
| C | 1.0000 |