Parallel Line Method in Excel with UNISTAT
The UNISTAT statistics add-in extends Excel with Parallel Line Method capabilities.
For further information visit UNISTAT User's Guide section 10.1. Parallel Line Method.
Here we provide a sample output from the UNISTAT Excel statistics add-in for data analysis.
| UNISTAT Bioassay Analysis | Version 10.11 |
|---|---|
| User: unist | Role: Supervisor |
| Date: 07/06/2020 21:50:34 | File: BioPharma9 |
Parallel Line Method
Valid Number of Cases: 60, 0 Omitted
Completely Randomised Design
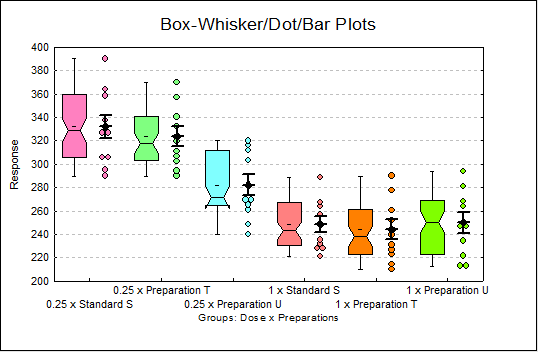
Summary Statistics
Data variable: Response
Subsample selected by: Dose x Preparations
Quantile Method: Simple Average
| Valid Cases | Mean | Median | Variance | |
|---|---|---|---|---|
| 0.25 x Standard S | 10 | 332.0000 | 329.0000 | 1026.6667 |
| 0.25 x Preparation T | 10 | 323.9000 | 318.0000 | 724.9889 |
| 0.25 x Preparation U | 10 | 282.2000 | 271.5000 | 854.6222 |
| 1 x Standard S | 10 | 248.4000 | 243.0000 | 483.8222 |
| 1 x Preparation T | 10 | 244.0000 | 238.0000 | 718.6667 |
| 1 x Preparation U | 10 | 250.0000 | 250.5000 | 784.6667 |
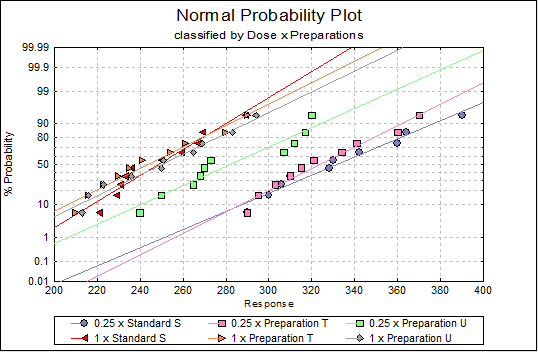
Shapiro-Wilk Normality Test
Alpha = 0.05
| Dose x Preparations | Test Statistic | Probability | Pass/Fail |
|---|---|---|---|
| 0.25 x Preparation T | 0.9471 | 0.6348 | Pass |
| 0.25 x Preparation U | 0.8940 | 0.1878 | Pass |
| 0.25 x Standard S | 0.9565 | 0.7451 | Pass |
| 1 x Preparation T | 0.9475 | 0.6390 | Pass |
| 1 x Preparation U | 0.9515 | 0.6864 | Pass |
| 1 x Standard S | 0.9302 | 0.4494 | Pass |
Kolmogorov-Smirnov Normality Test
Alpha = 0.05
| Dose x Preparations | Test Statistic | * Probability | Pass/Fail |
|---|---|---|---|
| 0.25 x Preparation T | 0.1429 | 0.2000 | Pass |
| 0.25 x Preparation U | 0.2235 | 0.1639 | Pass |
| 0.25 x Standard S | 0.1538 | 0.2000 | Pass |
| 1 x Preparation T | 0.1446 | 0.2000 | Pass |
| 1 x Preparation U | 0.1324 | 0.2000 | Pass |
| 1 x Standard S | 0.2135 | 0.2000 | Pass |
* Lilliefors probability = 0.2 means 0.2 or greater.
Cramer-von Mises Normality Test
Alpha = 0.05
| Dose x Preparations | Test Statistic | Probability | Pass/Fail |
|---|---|---|---|
| 0.25 x Preparation T | 0.0333 | 0.7721 | Pass |
| 0.25 x Preparation U | 0.0895 | 0.1360 | Pass |
| 0.25 x Standard S | 0.0331 | 0.7759 | Pass |
| 1 x Preparation T | 0.0341 | 0.7582 | Pass |
| 1 x Preparation U | 0.0278 | 0.8580 | Pass |
| 1 x Standard S | 0.0579 | 0.3692 | Pass |
Anderson-Darling Normality Test
Alpha = 0.05
| Dose x Preparations | Test Statistic | Probability | Pass/Fail |
|---|---|---|---|
| 0.25 x Preparation T | 0.2311 | 0.7326 | Pass |
| 0.25 x Preparation U | 0.5030 | 0.1549 | Pass |
| 0.25 x Standard S | 0.2218 | 0.7658 | Pass |
| 1 x Preparation T | 0.2337 | 0.7232 | Pass |
| 1 x Preparation U | 0.2055 | 0.8201 | Pass |
| 1 x Standard S | 0.3494 | 0.3962 | Pass |
Homogeneity of Variance Tests
For 6 groups defined by Dose x Preparations.
Alpha = 0.05
| Test Statistic | Probability | Pass/Fail | |
|---|---|---|---|
| Bartlett’s Chi-square Test | 1.2810 | 0.9369 | Pass |
| Bartlett-Box F Test | 0.2575 | 0.9362 | Pass |
| Cochran’s C (max var / sum var) | 0.2235 | 1.0000 | Pass |
| Hartley’s F (max var / min var) | 2.1220 | 0.0500 | Pass |
| Levene’s F Test | 0.3738 | 0.8644 | Pass |
Hartley’s F probability = 0.05 means 0.05 or greater.
Dixon’s Outlier Test
Alpha = 0.05
One-tailed tests
| Dose x Preparations | Dixon’s Q | Table Q | Pass/Fail |
|---|---|---|---|
| 0.25 x Preparation T Q(Min) | 0.0714 | 0.4779 | Pass |
| Q(Max) | 0.1333 | 0.4779 | Pass |
| 0.25 x Preparation U Q(Min) | 0.1299 | 0.4779 | Pass |
| Q(Max) | 0.0429 | 0.4779 | Pass |
| 0.25 x Standard S Q(Min) | 0.1351 | 0.4779 | Pass |
| Q(Max) | 0.2889 | 0.4779 | Pass |
| 1 x Preparation T Q(Min) | 0.0857 | 0.4779 | Pass |
| Q(Max) | 0.1351 | 0.4779 | Pass |
| 1 x Preparation U Q(Min) | 0.0429 | 0.4779 | Pass |
| Q(Max) | 0.1410 | 0.4779 | Pass |
| 1 x Standard S Q(Min) | 0.1667 | 0.4779 | Pass |
| Q(Max) | 0.3333 | 0.4779 | Pass |
N = 10, Q(Min)=(X(2)-X(1))/(X(N-1)-X(1)), Q(Max)=(X(N)-X(N-1))/(X(N)-X(2))
Grubbs’ Outlier Test
Alpha = 0.05
One-tailed tests
| Dose x Preparations | Grubbs’ G | Table G | Pass/Fail |
|---|---|---|---|
| 0.25 x Preparation T G(Min) | 1.2590 | 2.1761 | Pass |
| G(Max) | 1.7121 | 2.1761 | Pass |
| 0.25 x Preparation U G(Min) | 1.4435 | 2.1761 | Pass |
| G(Max) | 1.2930 | 2.1761 | Pass |
| 0.25 x Standard S G(Min) | 1.3108 | 2.1761 | Pass |
| G(Max) | 1.8101 | 2.1761 | Pass |
| 1 x Preparation T G(Min) | 1.2683 | 2.1761 | Pass |
| G(Max) | 1.7159 | 2.1761 | Pass |
| 1 x Preparation U G(Min) | 1.3209 | 2.1761 | Pass |
| G(Max) | 1.5708 | 2.1761 | Pass |
| 1 x Standard S G(Min) | 1.2457 | 2.1761 | Pass |
| G(Max) | 1.8458 | 2.1761 | Pass |
G = Maximum deviation from mean / Standard Deviation
ESD Outlier Test
Alpha = 0.05
Two-tailed test
Number of outliers to test (ESD) = 2
| Dose x Preparations | ESD Ri | Table Ri | Pass/Fail |
|---|---|---|---|
| 0.25 x Preparation T (Max) 1 | 1.7121 | 2.2900 | Pass |
| 0.25 x Preparation T (Max) 2 | 1.8069 | 2.2150 | Pass |
| 0.25 x Preparation U (Min) 1 | 1.4435 | 2.2900 | Pass |
| 0.25 x Preparation U (Min) 2 | 1.3804 | 2.2150 | Pass |
| 0.25 x Standard S (Max) 1 | 1.8101 | 2.2900 | Pass |
| 0.25 x Standard S (Max) 2 | 1.4659 | 2.2150 | Pass |
| 1 x Preparation T (Max) 1 | 1.7159 | 2.2900 | Pass |
| 1 x Preparation T (Max) 2 | 1.8123 | 2.2150 | Pass |
| 1 x Preparation U (Max) 1 | 1.5708 | 2.2900 | Pass |
| 1 x Preparation U (Max) 2 | 1.5292 | 2.2150 | Pass |
| 1 x Standard S (Max) 1 | 1.8458 | 2.2900 | Pass |
| 1 x Standard S (Max) 2 | 1.4140 | 2.2150 | Pass |
Ri = Generalised Extreme Studentised Deviate
Separate Regression
| Intercept | Slope | Residual SS | R-squared | Pass/Fail | |
|---|---|---|---|---|---|
| Standard S | 248.4000 | -60.3047 | 13594.4000 | 0.7199 | **Fail** |
| Preparation T | 244.0000 | -57.6357 | 12992.9000 | 0.7107 | **Fail** |
| Preparation U | 250.0000 | -23.2274 | 14753.6000 | 0.2600 | **Fail** |
Common Regression
| Intercept | Slope | Residual SS | R-squared | Pass/Fail | |
|---|---|---|---|---|---|
| Standard S | 257.5833 | -47.0559 | 49559.1333 | 0.5629 | **Fail** |
| Preparation T | 251.3333 | ||||
| Preparation U | 233.4833 |
| Residual Variance | 884.9845 |
|---|---|
| Degrees of Freedom | 56 |
Case (Diagnostic) Statistics
| Response | Dose | Preparations | Estimated Response | Residuals | Standardised Residuals | |
|---|---|---|---|---|---|---|
| 1 | 300 | 0.25 | Standard S | 322.8167 | -22.8167 | -0.7670 |
| 2 | 310 | 0.25 | Standard S | 322.8167 | -12.8167 | -0.4308 |
| 3 | 330 | 0.25 | Standard S | 322.8167 | 7.1833 | 0.2415 |
| 4 | 290 | 0.25 | Standard S | 322.8167 | -32.8167 | -1.1031 |
| 5 | 364 | 0.25 | Standard S | 322.8167 | 41.1833 | 1.3844 |
| 6 | 328 | 0.25 | Standard S | 322.8167 | 5.1833 | 0.1742 |
| ** 7 | 390 | 0.25 | Standard S | 322.8167 | 67.1833 | 2.2584 |
| 8 | 360 | 0.25 | Standard S | 322.8167 | 37.1833 | 1.2499 |
| 9 | 342 | 0.25 | Standard S | 322.8167 | 19.1833 | 0.6448 |
| 10 | 306 | 0.25 | Standard S | 322.8167 | -16.8167 | -0.5653 |
| 11 | 289 | 1 | Standard S | 257.5833 | 31.4167 | 1.0561 |
| 12 | 221 | 1 | Standard S | 257.5833 | -36.5833 | -1.2297 |
| 13 | 267 | 1 | Standard S | 257.5833 | 9.4167 | 0.3165 |
| 14 | 236 | 1 | Standard S | 257.5833 | -21.5833 | -0.7255 |
| 15 | 250 | 1 | Standard S | 257.5833 | -7.5833 | -0.2549 |
| 16 | 231 | 1 | Standard S | 257.5833 | -26.5833 | -0.8936 |
| 17 | 229 | 1 | Standard S | 257.5833 | -28.5833 | -0.9608 |
| 18 | 269 | 1 | Standard S | 257.5833 | 11.4167 | 0.3838 |
| 19 | 233 | 1 | Standard S | 257.5833 | -24.5833 | -0.8264 |
| 20 | 259 | 1 | Standard S | 257.5833 | 1.4167 | 0.0476 |
| 21 | 310 | 0.25 | Preparation T | 316.5667 | -6.5667 | -0.2207 |
| 22 | 290 | 0.25 | Preparation T | 316.5667 | -26.5667 | -0.8930 |
| 23 | 360 | 0.25 | Preparation T | 316.5667 | 43.4333 | 1.4600 |
| 24 | 341 | 0.25 | Preparation T | 316.5667 | 24.4333 | 0.8213 |
| 25 | 321 | 0.25 | Preparation T | 316.5667 | 4.4333 | 0.1490 |
| 26 | 370 | 0.25 | Preparation T | 316.5667 | 53.4333 | 1.7962 |
| 27 | 303 | 0.25 | Preparation T | 316.5667 | -13.5667 | -0.4560 |
| 28 | 334 | 0.25 | Preparation T | 316.5667 | 17.4333 | 0.5860 |
| 29 | 295 | 0.25 | Preparation T | 316.5667 | -21.5667 | -0.7250 |
| 30 | 315 | 0.25 | Preparation T | 316.5667 | -1.5667 | -0.0527 |
| 31 | 230 | 1 | Preparation T | 251.3333 | -21.3333 | -0.7171 |
| 32 | 210 | 1 | Preparation T | 251.3333 | -41.3333 | -1.3894 |
| 33 | 280 | 1 | Preparation T | 251.3333 | 28.6667 | 0.9636 |
| 34 | 261 | 1 | Preparation T | 251.3333 | 9.6667 | 0.3249 |
| 35 | 241 | 1 | Preparation T | 251.3333 | -10.3333 | -0.3474 |
| 36 | 290 | 1 | Preparation T | 251.3333 | 38.6667 | 1.2998 |
| 37 | 223 | 1 | Preparation T | 251.3333 | -28.3333 | -0.9524 |
| 38 | 254 | 1 | Preparation T | 251.3333 | 2.6667 | 0.0896 |
| 39 | 216 | 1 | Preparation T | 251.3333 | -35.3333 | -1.1877 |
| 40 | 235 | 1 | Preparation T | 251.3333 | -16.3333 | -0.5490 |
| 41 | 250 | 0.25 | Preparation U | 298.7167 | -48.7167 | -1.6376 |
| 42 | 268 | 0.25 | Preparation U | 298.7167 | -30.7167 | -1.0325 |
| 43 | 273 | 0.25 | Preparation U | 298.7167 | -25.7167 | -0.8645 |
| 44 | 240 | 0.25 | Preparation U | 298.7167 | -58.7167 | -1.9738 |
| 45 | 307 | 0.25 | Preparation U | 298.7167 | 8.2833 | 0.2784 |
| 46 | 270 | 0.25 | Preparation U | 298.7167 | -28.7167 | -0.9653 |
| 47 | 317 | 0.25 | Preparation U | 298.7167 | 18.2833 | 0.6146 |
| 48 | 312 | 0.25 | Preparation U | 298.7167 | 13.2833 | 0.4465 |
| 49 | 320 | 0.25 | Preparation U | 298.7167 | 21.2833 | 0.7154 |
| 50 | 265 | 0.25 | Preparation U | 298.7167 | -33.7167 | -1.1334 |
| 51 | 236 | 1 | Preparation U | 233.4833 | 2.5167 | 0.0846 |
| 52 | 213 | 1 | Preparation U | 233.4833 | -20.4833 | -0.6885 |
| 53 | 283 | 1 | Preparation U | 233.4833 | 49.5167 | 1.6645 |
| 54 | 269 | 1 | Preparation U | 233.4833 | 35.5167 | 1.1939 |
| 55 | 251 | 1 | Preparation U | 233.4833 | 17.5167 | 0.5888 |
| ** 56 | 294 | 1 | Preparation U | 233.4833 | 60.5167 | 2.0343 |
| 57 | 223 | 1 | Preparation U | 233.4833 | -10.4833 | -0.3524 |
| 58 | 250 | 1 | Preparation U | 233.4833 | 16.5167 | 0.5552 |
| 59 | 216 | 1 | Preparation U | 233.4833 | -17.4833 | -0.5877 |
| 60 | 265 | 1 | Preparation U | 233.4833 | 31.5167 | 1.0594 |
Responses marked by ‘**’ are outliers at 2 x Standard Deviation.
Comparison of Slopes
| Comparison | Difference | Standard Error | q Stat | Table q | Probability | Lower 95% | Upper 95% | Pass/Fail |
|---|---|---|---|---|---|---|---|---|
| Preparation U – Standard S | 37.0773 | 12.6231 | 2.9372 | 2.2713 | 0.0093 | 8.4061 | 65.7484 | **Fail** |
| Preparation T – Standard S | 2.6690 | 12.6231 | 0.2114 | 2.2713 | 0.9678 | -26.0022 | 31.3401 | Pass |
Validity of Assay
| Due To | Sum of Squares | DoF | Mean Square | F-Stat | Prob | Pass/Fail |
|---|---|---|---|---|---|---|
| Preparations | 6256.633 | 2 | 3128.317 | 4.086 | 0.0223 | Pass |
| Linear Regression | 63830.817 | 1 | 63830.817 | 83.377 | 0.0000 | Pass |
| Non-parallelism | 8218.233 | 2 | 4109.117 | 5.367 | 0.0075 | **Fail** |
| Non-linearity | 0.000 | 0 | * | |||
| Treatments | 78305.683 | 5 | 15661.137 | 20.457 | 0.0000 | Pass |
| Residual | 41340.900 | 54 | 765.572 | |||
| Total | 119646.583 | 59 | 2027.908 |
Potency
| Estimated Potency | Lower 95% | Upper 95% | |
|---|---|---|---|
| Preparation T | 1.1420 | 0.7836 | 1.6869 |
| Preparation U | 1.6689 | 1.1481 | 2.5550 |
| Relative Potency | Lower 95% | Upper 95% | |
|---|---|---|---|
| Preparation T | 114.20% | 78.36% | 168.69% |
| Preparation U | 166.89% | 114.81% | 255.50% |
| Percent CI | Lower 95% | Upper 95% | Pass/Fail | |
|---|---|---|---|---|
| Preparation T | 100.00% | 68.62% | 147.71% | **Fail** |
| Preparation U | 100.00% | 68.80% | 153.10% | **Fail** |
| UNISTAT Bioassay Analysis | Version 10.11 |
|---|---|
| User: unist | Role: Supervisor |
| Date: 07/06/2020 21:50:35 | File: BioPharma9 |
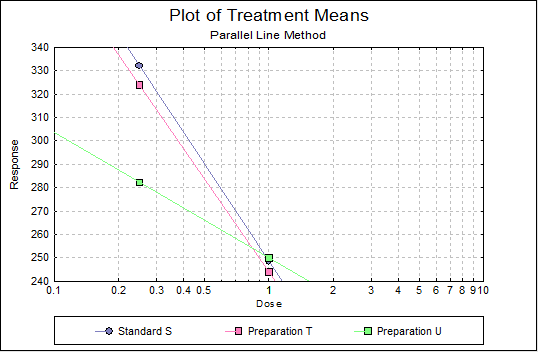
Parallel Line Method
Valid Number of Cases: 40, 0 Omitted
Randomised Block Design
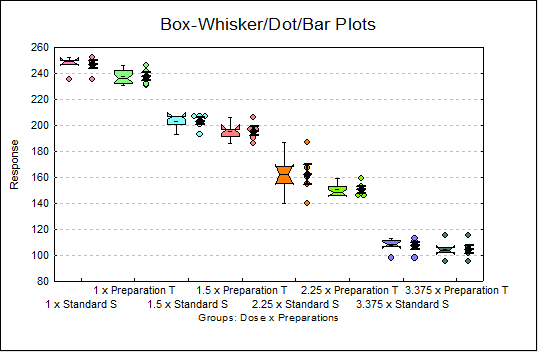
Separate Regression
| Intercept | Slope | Residual SS | R-squared | |
|---|---|---|---|---|
| Standard S | 248.5800 | -113.0060 | 1897.7400 | 0.9651 |
| Preparation T | 238.5000 | -109.5039 | 747.8000 | 0.9851 |
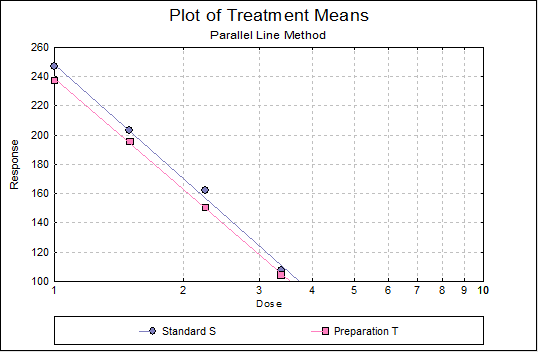
Common Regression
| Intercept | Slope | Residual SS | R-squared | |
|---|---|---|---|---|
| Standard S | 247.5150 | -111.2549 | 2670.7450 | 0.9744 |
| Preparation T | 239.5650 |
| Residual Variance | 72.1823 |
|---|---|
| Degrees of Freedom | 37 |
Case (Diagnostic) Statistics
| Response | Dose | Preparations | Rows | Estimated Response | Residuals | Standardised Residuals | |
|---|---|---|---|---|---|---|---|
| 1 | 252 | 1 | Standard S | 1 | 247.5150 | 4.4850 | 0.5279 |
| 2 | 249 | 1 | Standard S | 2 | 247.5150 | 1.4850 | 0.1748 |
| 3 | 247 | 1 | Standard S | 3 | 247.5150 | -0.5150 | -0.0606 |
| 4 | 250 | 1 | Standard S | 4 | 247.5150 | 2.4850 | 0.2925 |
| 5 | 235 | 1 | Standard S | 5 | 247.5150 | -12.5150 | -1.4730 |
| 6 | 207 | 1.5 | Standard S | 1 | 202.4050 | 4.5950 | 0.5408 |
| 7 | 201 | 1.5 | Standard S | 2 | 202.4050 | -1.4050 | -0.1654 |
| 8 | 193 | 1.5 | Standard S | 3 | 202.4050 | -9.4050 | -1.1070 |
| 9 | 207 | 1.5 | Standard S | 4 | 202.4050 | 4.5950 | 0.5408 |
| 10 | 207 | 1.5 | Standard S | 5 | 202.4050 | 4.5950 | 0.5408 |
| 11 | 168 | 2.25 | Standard S | 1 | 157.2950 | 10.7050 | 1.2600 |
| ** 12 | 187 | 2.25 | Standard S | 2 | 157.2950 | 29.7050 | 3.4963 |
| 13 | 162 | 2.25 | Standard S | 3 | 157.2950 | 4.7050 | 0.5538 |
| 14 | 155 | 2.25 | Standard S | 4 | 157.2950 | -2.2950 | -0.2701 |
| ** 15 | 140 | 2.25 | Standard S | 5 | 157.2950 | -17.2950 | -2.0357 |
| 16 | 113 | 3.375 | Standard S | 1 | 112.1850 | 0.8150 | 0.0959 |
| 17 | 107 | 3.375 | Standard S | 2 | 112.1850 | -5.1850 | -0.6103 |
| 18 | 111 | 3.375 | Standard S | 3 | 112.1850 | -1.1850 | -0.1395 |
| 19 | 108 | 3.375 | Standard S | 4 | 112.1850 | -4.1850 | -0.4926 |
| 20 | 98 | 3.375 | Standard S | 5 | 112.1850 | -14.1850 | -1.6696 |
| 21 | 242 | 1 | Preparation T | 1 | 239.5650 | 2.4350 | 0.2866 |
| 22 | 236 | 1 | Preparation T | 2 | 239.5650 | -3.5650 | -0.4196 |
| 23 | 246 | 1 | Preparation T | 3 | 239.5650 | 6.4350 | 0.7574 |
| 24 | 231 | 1 | Preparation T | 4 | 239.5650 | -8.5650 | -1.0081 |
| 25 | 232 | 1 | Preparation T | 5 | 239.5650 | -7.5650 | -0.8904 |
| 26 | 206 | 1.5 | Preparation T | 1 | 194.4550 | 11.5450 | 1.3589 |
| 27 | 197 | 1.5 | Preparation T | 2 | 194.4550 | 2.5450 | 0.2996 |
| 28 | 197 | 1.5 | Preparation T | 3 | 194.4550 | 2.5450 | 0.2996 |
| 29 | 191 | 1.5 | Preparation T | 4 | 194.4550 | -3.4550 | -0.4067 |
| 30 | 186 | 1.5 | Preparation T | 5 | 194.4550 | -8.4550 | -0.9952 |
| 31 | 146 | 2.25 | Preparation T | 1 | 149.3450 | -3.3450 | -0.3937 |
| 32 | 153 | 2.25 | Preparation T | 2 | 149.3450 | 3.6550 | 0.4302 |
| 33 | 148 | 2.25 | Preparation T | 3 | 149.3450 | -1.3450 | -0.1583 |
| 34 | 159 | 2.25 | Preparation T | 4 | 149.3450 | 9.6550 | 1.1364 |
| 35 | 146 | 2.25 | Preparation T | 5 | 149.3450 | -3.3450 | -0.3937 |
| 36 | 115 | 3.375 | Preparation T | 1 | 104.2350 | 10.7650 | 1.2671 |
| 37 | 102 | 3.375 | Preparation T | 2 | 104.2350 | -2.2350 | -0.2631 |
| 38 | 104 | 3.375 | Preparation T | 3 | 104.2350 | -0.2350 | -0.0277 |
| 39 | 106 | 3.375 | Preparation T | 4 | 104.2350 | 1.7650 | 0.2077 |
| 40 | 95 | 3.375 | Preparation T | 5 | 104.2350 | -9.2350 | -1.0870 |
Responses marked by ‘**’ are outliers at 2 x Standard Deviation.
Comparison of Slopes
| Comparison | Difference | Standard Error | q Stat | Table q | Probability | Lower 95% | Upper 95% |
|---|---|---|---|---|---|---|---|
| Preparation T – Standard S | 3.5022 | 5.1221 | 0.6837 | 2.0484 | 0.4998 | -6.9901 | 13.9944 |
Validity of Assay
| Due To | Sum of Squares | DoF | Mean Square | F-Stat | Prob |
|---|---|---|---|---|---|
| Preparations | 632.025 | 1 | 632.025 | 11.722 | 0.0019 |
| Linear Regression | 101745.605 | 1 | 101745.605 | 1887.111 | 0.0000 |
| Non-parallelism | 25.205 | 1 | 25.205 | 0.467 | 0.4998 |
| Non-linearity | 259.140 | 4 | 64.785 | 1.202 | 0.3321 |
| Standard S Non-linearity | 238.140 | 2 | 119.070 | 2.208 | 0.1287 |
| Preparation T Non-linearity | 21.000 | 2 | 10.500 | 0.195 | 0.8241 |
| Quadratic Regression | 148.225 | 1 | 148.225 | 2.749 | 0.1085 |
| Quadratic Difference | 34.225 | 1 | 34.225 | 0.635 | 0.4323 |
| Residual | 76.690 | 2 | 38.345 | ||
| Treatments | 102661.975 | 7 | 14665.996 | 272.015 | 0.0000 |
| Blocks(Rows) | 876.750 | 4 | 219.188 | 4.065 | 0.0101 |
| Residual | 1509.650 | 28 | 53.916 | ||
| Total | 105048.375 | 39 | 2693.548 |
Potency
Randomised Block Design
Assigned potency of Standard S: 670 IU/mg
Pre-dilution of Standard S: 16.7 mg / 25 ml; 1 ml / 40 ml
Assumed potency of Preparation T: 20000 IU/vial
Pre-dilution of Preparation T: 1 vial / 40 ml; 1 ml / 40 ml
| Estimated Potency | Lower 95% | Upper 95% | |
|---|---|---|---|
| Preparation T | 19228.4755 | 18423.3508 | 20075.1776 |
| Relative Potency | Lower 95% | Upper 95% | |
|---|---|---|---|
| Preparation T | 107.41% | 102.91% | 112.14% |
| Percent CI | Lower 95% | Upper 95% | |
|---|---|---|---|
| Preparation T | 100.00% | 95.81% | 104.40% |
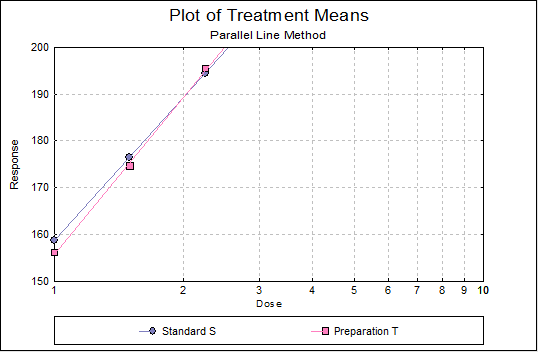
Parallel Line Method
Valid Number of Cases: 36, 0 Omitted
Latin Squares Design
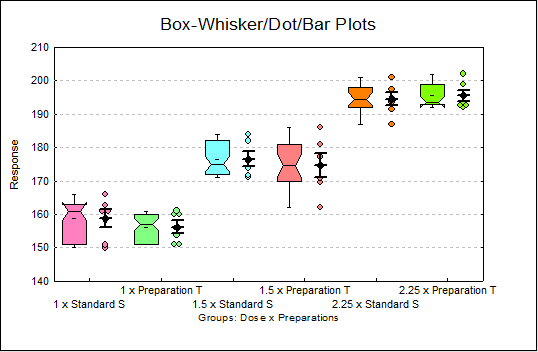
Separate Regression
| Intercept | Slope | Residual SS | R-squared | |
|---|---|---|---|---|
| Standard S | 158.6389 | 44.1879 | 478.3611 | 0.8895 |
| Preparation T | 155.7778 | 48.5040 | 573.1111 | 0.8901 |
Common Regression
| Intercept | Slope | Residual SS | R-squared | |
|---|---|---|---|---|
| Standard S | 157.7639 | 46.3460 | 1069.8472 | 0.8879 |
| Preparation T | 156.6528 |
| Residual Variance | 32.4196 |
|---|---|
| Degrees of Freedom | 33 |
Case (Diagnostic) Statistics
| Response | Dose | Preparations | Rows | Columns | Estimated Response | Residuals | Standardised Residuals | |
|---|---|---|---|---|---|---|---|---|
| 1 | 161 | 1 | Standard S | 1 | 1 | 157.7639 | 3.2361 | 0.5684 |
| 2 | 151 | 1 | Preparation T | 2 | 1 | 156.6528 | -5.6528 | -0.9928 |
| ** 3 | 162 | 1.5 | Preparation T | 3 | 1 | 175.4444 | -13.4444 | -2.3612 |
| 4 | 194 | 2.25 | Standard S | 4 | 1 | 195.3472 | -1.3472 | -0.2366 |
| 5 | 176 | 1.5 | Standard S | 5 | 1 | 176.5556 | -0.5556 | -0.0976 |
| 6 | 193 | 2.25 | Preparation T | 6 | 1 | 194.2361 | -1.2361 | -0.2171 |
| 7 | 160 | 1 | Preparation T | 1 | 2 | 156.6528 | 3.3472 | 0.5879 |
| 8 | 192 | 2.25 | Preparation T | 2 | 2 | 194.2361 | -2.2361 | -0.3927 |
| 9 | 195 | 2.25 | Standard S | 3 | 2 | 195.3472 | -0.3472 | -0.0610 |
| 10 | 184 | 1.5 | Standard S | 4 | 2 | 176.5556 | 7.4444 | 1.3075 |
| 11 | 181 | 1.5 | Preparation T | 5 | 2 | 175.4444 | 5.5556 | 0.9757 |
| 12 | 166 | 1 | Standard S | 6 | 2 | 157.7639 | 8.2361 | 1.4465 |
| 13 | 178 | 1.5 | Preparation T | 1 | 3 | 175.4444 | 2.5556 | 0.4488 |
| 14 | 150 | 1 | Standard S | 2 | 3 | 157.7639 | -7.7639 | -1.3636 |
| 15 | 174 | 1.5 | Standard S | 3 | 3 | 176.5556 | -2.5556 | -0.4488 |
| 16 | 199 | 2.25 | Preparation T | 4 | 3 | 194.2361 | 4.7639 | 0.8367 |
| 17 | 201 | 2.25 | Standard S | 5 | 3 | 195.3472 | 5.6528 | 0.9928 |
| 18 | 161 | 1 | Preparation T | 6 | 3 | 156.6528 | 4.3472 | 0.7635 |
| 19 | 187 | 2.25 | Standard S | 1 | 4 | 195.3472 | -8.3472 | -1.4660 |
| 20 | 172 | 1.5 | Standard S | 2 | 4 | 176.5556 | -4.5556 | -0.8001 |
| 21 | 161 | 1 | Standard S | 3 | 4 | 157.7639 | 3.2361 | 0.5684 |
| 22 | 160 | 1 | Preparation T | 4 | 4 | 156.6528 | 3.3472 | 0.5879 |
| 23 | 202 | 2.25 | Preparation T | 5 | 4 | 194.2361 | 7.7639 | 1.3636 |
| 24 | 186 | 1.5 | Preparation T | 6 | 4 | 175.4444 | 10.5556 | 1.8539 |
| 25 | 171 | 1.5 | Standard S | 1 | 5 | 176.5556 | -5.5556 | -0.9757 |
| 26 | 170 | 1.5 | Preparation T | 2 | 5 | 175.4444 | -5.4444 | -0.9562 |
| 27 | 193 | 2.25 | Preparation T | 3 | 5 | 194.2361 | -1.2361 | -0.2171 |
| 28 | 163 | 1 | Standard S | 4 | 5 | 157.7639 | 5.2361 | 0.9196 |
| 29 | 154 | 1 | Preparation T | 5 | 5 | 156.6528 | -2.6528 | -0.4659 |
| 30 | 198 | 2.25 | Standard S | 6 | 5 | 195.3472 | 2.6528 | 0.4659 |
| 31 | 194 | 2.25 | Preparation T | 1 | 6 | 194.2361 | -0.2361 | -0.0415 |
| 32 | 192 | 2.25 | Standard S | 2 | 6 | 195.3472 | -3.3472 | -0.5879 |
| 33 | 151 | 1 | Preparation T | 3 | 6 | 156.6528 | -5.6528 | -0.9928 |
| 34 | 171 | 1.5 | Preparation T | 4 | 6 | 175.4444 | -4.4444 | -0.7806 |
| 35 | 151 | 1 | Standard S | 5 | 6 | 157.7639 | -6.7639 | -1.1879 |
| 36 | 182 | 1.5 | Standard S | 6 | 6 | 176.5556 | 5.4444 | 0.9562 |
Responses marked by ‘**’ are outliers at 2 x Standard Deviation.
Comparison of Slopes
| Comparison | Difference | Standard Error | q Stat | Table q | Probability | Lower 95% | Upper 95% |
|---|---|---|---|---|---|---|---|
| Preparation T – Standard S | 4.3160 | 4.5883 | 0.9407 | 2.0860 | 0.3581 | -5.2551 | 13.8871 |
Validity of Assay
| Due To | Sum of Squares | DoF | Mean Square | F-Stat | Prob |
|---|---|---|---|---|---|
| Preparations | 11.111 | 1 | 11.111 | 0.535 | 0.4730 |
| Linear Regression | 8475.042 | 1 | 8475.042 | 408.108 | 0.0000 |
| Non-parallelism | 18.375 | 1 | 18.375 | 0.885 | 0.3581 |
| Non-linearity | 5.472 | 2 | 2.736 | 0.132 | 0.8773 |
| Standard S Non-linearity | 0.028 | 1 | 0.028 | 0.001 | 0.9712 |
| Preparation T Non-linearity | 5.444 | 1 | 5.444 | 0.262 | 0.6142 |
| Quadratic Regression | 3.125 | 1 | 3.125 | 0.150 | 0.7022 |
| Quadratic Difference | 2.347 | 1 | 2.347 | 0.113 | 0.7402 |
| Treatments | 8510.000 | 5 | 1702.000 | 81.958 | 0.0000 |
| Blocks(Rows) | 412.000 | 5 | 82.400 | 3.968 | 0.0116 |
| Blocks(Columns) | 218.667 | 5 | 43.733 | 2.106 | 0.1069 |
| Residual | 415.333 | 20 | 20.767 | ||
| Total | 9556.000 | 35 | 273.029 |
Potency
Latin Squares Design
Assigned potency of Standard S: 4855 IU/mg
Pre-dilution of Standard S: 25.2 mg / 24.5 ml
Assumed potency of Preparation T: 5600 IU/mg
Pre-dilution of Preparation T: 21.4 mg / 23.95 ml
| Estimated Potency | Lower 95% | Upper 95% | |
|---|---|---|---|
| Preparation T | 5456.3665 | 5092.3689 | 5843.3620 |
| Relative Potency | Lower 95% | Upper 95% | |
|---|---|---|---|
| Preparation T | 97.63% | 91.12% | 104.56% |
| Percent CI | Lower 95% | Upper 95% | |
|---|---|---|---|
| Preparation T | 100.00% | 93.33% | 107.09% |