Principal Components Analysis in Excel with UNISTAT
The UNISTAT statistics add-in extends Excel with Principal Components Analysis capabilities.
For further information visit UNISTAT User's Guide section 8.4. Principal Components Analysis.
Here we provide a sample output from the UNISTAT Excel statistics add-in for data analysis.
Principal Components Analysis
Variables Selected: Perf, Info, Verbexp, Age
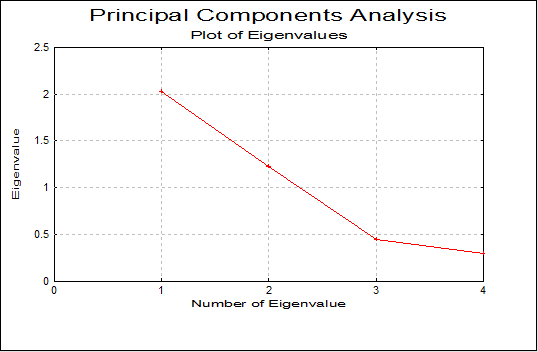
Variance Table
| Component No | Eigenvalue | Cumulative Variance | Percent | Cumulative |
|---|---|---|---|---|
| 1 | 2.0293 | 2.0293 | 0.5073 | 0.5073 |
| 2 | 1.2233 | 3.2527 | 0.3058 | 0.8132 |
| 3 | 0.4467 | 3.6993 | 0.1117 | 0.9248 |
| 4 | 0.3007 | 4.0000 | 0.0752 | 1.0000 |
Eigenvectors
| Component 1 | Component 2 | Component 3 | Component 4 | |
|---|---|---|---|---|
| Perf | 0.5951 | -0.3051 | 0.0912 | -0.7379 |
| Info | 0.5252 | 0.3946 | -0.7346 | 0.1697 |
| Verbexp | 0.3939 | 0.6323 | 0.6529 | 0.1370 |
| Age | 0.4635 | -0.5928 | 0.1605 | 0.6388 |
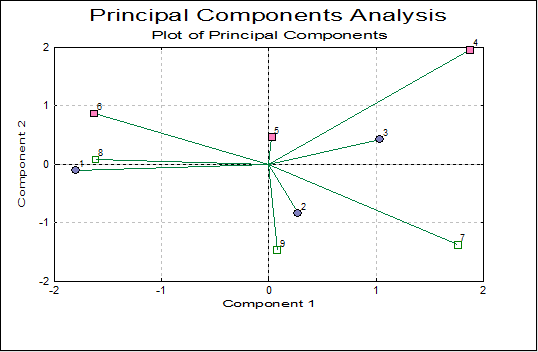
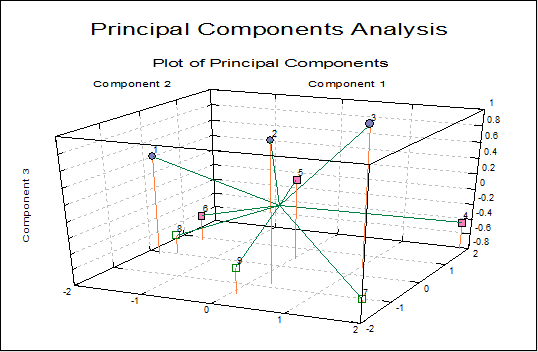
Principal Components
| Component 1 | Component 2 | Component 3 | Component 4 | |
|---|---|---|---|---|
| 1 | -1.7956 | -0.1063 | 0.4799 | -0.4934 |
| 2 | 0.2714 | -0.8446 | 0.9379 | 0.5775 |
| 3 | 1.0354 | 0.4251 | 0.9860 | -0.7623 |
| 4 | 1.8729 | 1.9593 | -0.4486 | 0.0596 |
| 5 | 0.0277 | 0.4637 | 0.2356 | 0.9030 |
| 6 | -1.6291 | 0.8704 | -0.4635 | 0.1744 |
| 7 | 1.7565 | -1.3786 | -0.6916 | -0.4088 |
| 8 | -1.6158 | 0.0817 | -0.5666 | -0.3639 |
| 9 | 0.0766 | -1.4707 | -0.4692 | 0.3139 |