K-Means Cluster Analysis in Excel with UNISTAT
The UNISTAT statistics add-in extends Excel with K-Means Cluster Analysis capabilities.
For further information visit UNISTAT User's Guide section 8.1.3. K-Means Cluster Analysis.
Here we provide a sample output from the UNISTAT Excel statistics add-in for data analysis.
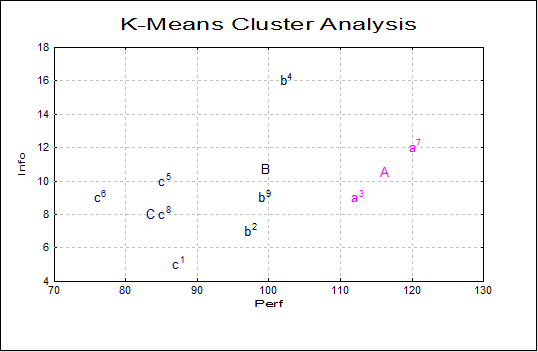
K-Means Cluster Analysis
Variables Selected: Perf, Info, Verbexp, Age
Cluster Table
| Cluster | Seed | Cases | Percentage | SSQ |
|---|---|---|---|---|
| 1 | 2 | 2 | 22.22% | 109.2200 |
| 2 | 5 | 3 | 33.33% | 220.3800 |
| 3 | 8 | 4 | 44.44% | 140.7875 |
Cluster Membership
| Observation | Cluster |
|---|---|
| 1 | 3 |
| 2 | 2 |
| 3 | 1 |
| 4 | 2 |
| 5 | 3 |
| 6 | 3 |
| 7 | 1 |
| 8 | 3 |
| 9 | 2 |
Final Cluster Centres
| Seed | Perf | Info | Verbexp | Age |
|---|---|---|---|---|
| 2 | 116.0000 | 10.5000 | 36.0000 | 7.8000 |
| 5 | 99.3333 | 10.6667 | 36.0000 | 7.8333 |
| 8 | 83.2500 | 8.0000 | 32.2500 | 6.6250 |