Logit / Probit / Gompit in Excel with UNISTAT
The UNISTAT statistics add-in extends Excel with Logit / Probit / Gompit capabilities.
For further information visit UNISTAT User's Guide section 7.2.5. Logit / Probit / Gompit.
Here we provide a sample output from the UNISTAT Excel statistics add-in for data analysis.
Logit / Probit / Gompit
Model selected: Logit
Response Variable: Hypertension
Subject Variable: Total
Valid Number of Cases: 8, 0 Omitted
Regression Results
| Coefficient | Standard Error | Z-Statistic | 2-Tail Probability | Lower 95% | Upper 95% | |
|---|---|---|---|---|---|---|
| Constant | -2.3777 | 0.3802 | -6.2540 | 0.0000 | -3.1228 | -1.6325 |
| Smoking | -0.0678 | 0.2781 | -0.2437 | 0.8075 | -0.6129 | 0.4773 |
| Obesity | 0.6953 | 0.2851 | 2.4390 | 0.0147 | 0.1366 | 1.2541 |
| Snoring | 0.8719 | 0.3976 | 2.1932 | 0.0283 | 0.0927 | 1.6512 |
Goodness of Fit Tests
| -2 Log likelihood | |
|---|---|
| Initial Model | 411.4239 |
| Final Model | 398.9164 |
| Chi-Square Statistic | Degrees of Freedom | Right-Tail Probability | |
|---|---|---|---|
| Pearson | 1.3643 | 4 | 0.8504 |
| Likelihood Ratio | 12.5075 | 3 | 0.0058 |
| Pseudo R-squared | |
|---|---|
| McFadden | 0.0304 |
| Adjusted McFadden | 0.0110 |
| Cox & Snell | 0.0285 |
| Nagelkerke | 0.0464 |
Correlation Matrix of Regression Coefficients
| Constant | Smoking | Obesity | Snoring | |
|---|---|---|---|---|
| Constant | 1.0000 | -0.1520 | -0.1360 | -0.8965 |
| Smoking | -0.1520 | 1.0000 | -0.0001 | -0.0671 |
| Obesity | -0.1360 | -0.0001 | 1.0000 | -0.0718 |
| Snoring | -0.8965 | -0.0671 | -0.0718 | 1.0000 |
Covariance Matrix of Regression Coefficients
| Constant | Smoking | Obesity | Snoring | |
|---|---|---|---|---|
| Constant | 0.1445 | -0.0161 | -0.0147 | -0.1355 |
| Smoking | -0.0161 | 0.0774 | -0.0000 | -0.0074 |
| Obesity | -0.0147 | -0.0000 | 0.0813 | -0.0081 |
| Snoring | -0.1355 | -0.0074 | -0.0081 | 0.1581 |
Case (Diagnostic) Statistics
| Subjects | Responses | Expected Responses | Residuals | |
|---|---|---|---|---|
| 1 | 60 | 5 | 5.0935 | -0.0935 |
| 2 | 17 | 2 | 1.3561 | 0.6439 |
| 3 | 8 | 1 | 1.2543 | -0.2543 |
| 4 | 2 | 0 | 0.2961 | -0.2961 |
| 5 | 187 | 35 | 33.9543 | 1.0457 |
| 6 | 85 | 13 | 14.5961 | -1.5961 |
| 7 | 51 | 15 | 15.6979 | -0.6979 |
| 8 | 23 | 8 | 6.7517 | 1.2483 |
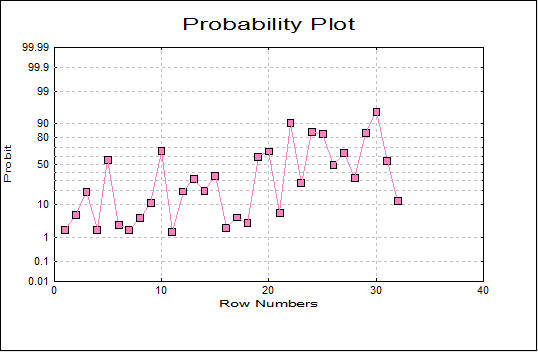
Logit / Probit / Gompit
Model selected: Probit
Dependent Variable: GRADE
Minimum of dependent variable is encoded as 0 and the rest as 1.
Valid Number of Cases: 32, 0 Omitted
Regression Results
| Coefficient | Standard Error | Z-Statistic | 2-Tail Probability | Lower 95% | Upper 95% | |
|---|---|---|---|---|---|---|
| Constant | -7.4523 | 2.5425 | -2.9311 | 0.0034 | -12.4355 | -2.4692 |
| GPA | 1.6258 | 0.6939 | 2.3431 | 0.0191 | 0.2658 | 2.9858 |
| TUCE | 0.0517 | 0.0839 | 0.6166 | 0.5375 | -0.1127 | 0.2162 |
| PSI | 1.4263 | 0.5950 | 2.3970 | 0.0165 | 0.2601 | 2.5926 |
Goodness of Fit Tests
| -2 Log likelihood | |
|---|---|
| Initial Model | 41.1835 |
| Final Model | 25.6376 |
| Chi-Square Statistic | Degrees of Freedom | Right-Tail Probability | |
|---|---|---|---|
| Pearson | 26.2516 | 27 | 0.5047 |
| Likelihood Ratio | 15.5459 | 3 | 0.0014 |
| Pseudo R-squared | |
|---|---|
| McFadden | 0.3775 |
| Adjusted McFadden | 0.1832 |
| Cox & Snell | 0.3848 |
| Nagelkerke | 0.5316 |
Correlation Matrix of Regression Coefficients
| Constant | GPA | TUCE | PSI | |
|---|---|---|---|---|
| Constant | 1.0000 | -0.6630 | -0.4743 | -0.3932 |
| GPA | -0.6630 | 1.0000 | -0.3249 | 0.2554 |
| TUCE | -0.4743 | -0.3249 | 1.0000 | 0.0495 |
| PSI | -0.3932 | 0.2554 | 0.0495 | 1.0000 |
Covariance Matrix of Regression Coefficients
| Constant | GPA | TUCE | PSI | |
|---|---|---|---|---|
| Constant | 6.4642 | -1.1697 | -0.1012 | -0.5948 |
| GPA | -1.1697 | 0.4815 | -0.0189 | 0.1054 |
| TUCE | -0.1012 | -0.0189 | 0.0070 | 0.0025 |
| PSI | -0.5948 | 0.1054 | 0.0025 | 0.3541 |
Marginal Effects
| Coefficient | Standard Error | Z-Statistic | 2-Tail Probability | Lower 95% | Upper 95% | X | |
|---|---|---|---|---|---|---|---|
| GPA | 0.5333 | 0.2325 | 2.2943 | 0.0218 | 0.0777 | 0.9890 | 3.1172 |
| TUCE | 0.0170 | 0.0271 | 0.6257 | 0.5315 | -0.0362 | 0.0701 | 21.9375 |
| * PSI | 0.4644 | 0.1703 | 2.7274 | 0.0064 | 0.1307 | 0.7982 | 0.4375 |
| x’B | -0.6255 |
|---|---|
| Predicted Probability | 0.2658 |
| f*x’B | -0.2052 |
| Predicted Marginal Probability | 0.4187 |
* Binary independent variable
Average Effects
| Coefficient | Standard Error | Z-Statistic | 2-Tail Probability | Lower 95% | Upper 95% | |
|---|---|---|---|---|---|---|
| GPA | 0.3608 | 0.1134 | 3.1821 | 0.0015 | 0.1386 | 0.5830 |
| TUCE | 0.0115 | 0.0184 | 0.6236 | 0.5329 | -0.0246 | 0.0476 |
| * PSI | 0.3738 | 0.1400 | 2.6698 | 0.0076 | 0.0994 | 0.6481 |
* Binary independent variable
Case (Diagnostic) Statistics
| Actual Y | Fitted Y | Residuals | Probability | |
|---|---|---|---|---|
| 1 | 0 | 0.0182 | -0.0182 | 0.0182 |
| 2 | 0 | 0.0531 | -0.0531 | 0.0531 |
| 3 | 0 | 0.1899 | -0.1899 | 0.1899 |
| 4 | 0 | 0.0186 | -0.0186 | 0.0186 |
| 5 | 1 | 0.5546 | 0.4454 | 0.5546 |
| 6 | 0 | 0.0272 | -0.0272 | 0.0272 |
| 7 | 0 | 0.0185 | -0.0185 | 0.0185 |
| 8 | 0 | 0.0446 | -0.0446 | 0.0446 |
| 9 | 0 | 0.1088 | -0.1088 | 0.1088 |
| 10 | 1 | 0.6631 | 0.3369 | 0.6631 |
| 11 | 0 | 0.0161 | -0.0161 | 0.0161 |
| 12 | 0 | 0.1936 | -0.1936 | 0.1936 |
| 13 | 0 | 0.3233 | -0.3233 | 0.3233 |
| 14 | 1 | 0.1952 | 0.8048 | 0.1952 |
| 15 | 0 | 0.3563 | -0.3563 | 0.3563 |
| 16 | 0 | 0.0220 | -0.0220 | 0.0220 |
| 17 | 0 | 0.0457 | -0.0457 | 0.0457 |
| 18 | 0 | 0.0309 | -0.0309 | 0.0309 |
| 19 | 0 | 0.5934 | -0.5934 | 0.5934 |
| 20 | 1 | 0.6572 | 0.3428 | 0.6572 |
| 21 | 0 | 0.0619 | -0.0619 | 0.0619 |
| 22 | 1 | 0.9045 | 0.0955 | 0.9045 |
| 23 | 0 | 0.2732 | -0.2732 | 0.2732 |
| 24 | 0 | 0.8475 | -0.8475 | 0.8475 |
| 25 | 1 | 0.8342 | 0.1658 | 0.8342 |
| 26 | 1 | 0.4887 | 0.5113 | 0.4887 |
| 27 | 1 | 0.6424 | 0.3576 | 0.6424 |
| 28 | 0 | 0.3287 | -0.3287 | 0.3287 |
| 29 | 1 | 0.8400 | 0.1600 | 0.8400 |
| 30 | 1 | 0.9522 | 0.0478 | 0.9522 |
| 31 | 0 | 0.5400 | -0.5400 | 0.5400 |
| 32 | 1 | 0.1235 | 0.8765 | 0.1235 |