3D Histogram in Excel with UNISTAT
The UNISTAT statistics add-in extends Excel with 3D Histogram capabilities.
For further information visit UNISTAT User's Guide section 5.3.4. 3D Histogram.
Here we provide a sample output from the UNISTAT Excel statistics add-in for data analysis.
3D Histogram
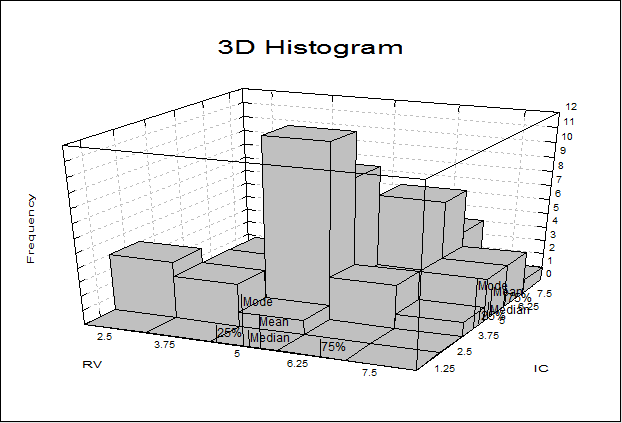
Frequency Table
| IC \ RV | 2 | 3 | 4 | 5 | 6 | Total |
|---|---|---|---|---|---|---|
| 1 | 0 | 0 | 0 | 0 | 0 | 0 |
| 2 | 4 | 3 | 1 | 0 | 0 | 8 |
| 3 | 0 | 3 | 12 | 3 | 1 | 19 |
| 4 | 0 | 3 | 9 | 2 | 3 | 17 |
| 5 | 0 | 0 | 1 | 7 | 3 | 11 |
| 6 | 0 | 0 | 0 | 4 | 1 | 5 |
| Total | 4 | 9 | 23 | 16 | 8 | 60 |
Descriptive Statistics
| RV | IC | |
|---|---|---|
| Mean | 5.3240 | 4.7218 |
| Median | 5.1050 | 4.6100 |
| Mode | 5.0000 | 3.7500 |
| Lower Quartile | 4.4900 | 4.0750 |
| Upper Quartile | 6.4200 | 5.6850 |