Specific Assays in Excel with UNISTAT
The UNISTAT statistics add-in extends Excel with Specific Assays capabilities.
For further information visit UNISTAT User's Guide section 10.6. Specific Assays.
Here we provide a sample output from the UNISTAT Excel statistics add-in for data analysis.
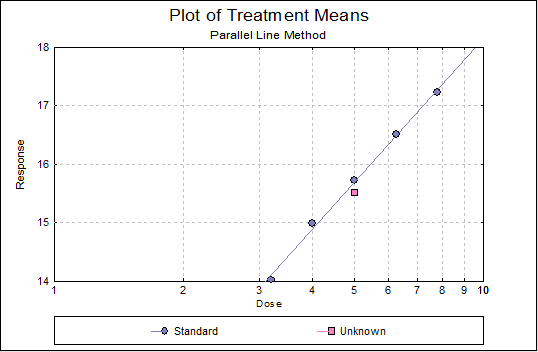
Parallel Line Method
Completely Randomised Design
Cylinder-Plate 5+1 Assay
| Preparations | Dose | Mean (Odd well nos) | Standard Deviation | %RSD | Mean (Even well nos) | Standard Deviation | %RSD | Corrected Means |
|---|---|---|---|---|---|---|---|---|
| Standard | 3.2 | 15.8667 | 0.2000 | 1.3 | 14.1667 | 0.3240 | 2.3 | 14.0222 |
| Standard | 4 | 15.5667 | 0.1581 | 1.0 | 14.8333 | 0.2646 | 1.8 | 14.9889 |
| Standard | 5 | 15.7222 | 15.7222 | |||||
| Standard | 6.25 | 15.7889 | 0.1691 | 1.1 | 16.5778 | 0.2333 | 1.4 | 16.5111 |
| Standard | 7.8125 | 15.6667 | 0.1414 | 0.9 | 17.1667 | 0.2236 | 1.3 | 17.2222 |
| Unknown | 5 | 15.6778 | 0.1787 | 1.1 | 15.4778 | 0.3073 | 2.0 | 15.5222 |
Data
| Response | Dose | Preparations | |
|---|---|---|---|
| 1 | 14.02222222222 | 3.2 | Standard |
| 2 | 14.98888888889 | 4 | Standard |
| 3 | 15.72222222222 | 5 | Standard |
| 4 | 16.51111111111 | 6.25 | Standard |
| 5 | 17.22222222222 | 7.8125 | Standard |
| 6 | 15.52222222222 | 5 | Unknown |
Validity of Assay
| Due To | Sum of Squares | DoF | Mean Square | F-Stat | Prob |
|---|---|---|---|---|---|
| Constant | 1472.319 | 1 | 1472.319 | ||
| Preparations | 0.024 | 1 | 0.024 | 3.699 | 0.1502 |
| Linear Regression | 6.276 | 1 | 6.276 | 951.408 | 0.0001 |
| Non-linearity | 0.020 | 3 | 0.007 | ||
| Treatments | 6.320 | 5 | 1.264 | ||
| Residual | 0.000 | 0 | |||
| Total | 6.320 | 5 | 1.264 |
Separate Regression
| Intercept | Slope | Residual SS | R-squared | |
|---|---|---|---|---|
| Standard | 9.9794 | 3.5503 | 0.0198 | 0.9969 |
| Unknown | * | * | * | * |
Common Regression
| Intercept | Slope | Residual SS | R-squared | |
|---|---|---|---|---|
| Standard | 9.9794 | 3.5503 | 0.0198 | 0.9969 |
| Unknown | 9.8083 |
| Residual Variance | 0.0066 |
|---|---|
| Degrees of Freedom | 3 |
Case (Diagnostic) Statistics
| Response | Dose | Preparations | Estimated Response | Residuals | Standardised Residuals | |
|---|---|---|---|---|---|---|
| 1 | 14.02222222222 | 3.2 | Standard | 14.1089 | -0.0867 | -1.0671 |
| 2 | 14.98888888889 | 4 | Standard | 14.9011 | 0.0878 | 1.0807 |
| 3 | 15.72222222222 | 5 | Standard | 15.6933 | 0.0289 | 0.3557 |
| 4 | 16.51111111111 | 6.25 | Standard | 16.4856 | 0.0256 | 0.3146 |
| 5 | 17.22222222222 | 7.8125 | Standard | 17.2778 | -0.0556 | -0.6840 |
| 6 | 15.52222222222 | 5 | Unknown | 15.5222 | 0.0000 | 0.0000 |
Potency
0 residual SSQ and DoF replaced by non-linearity SSQ and DoF.
| Estimated Potency | Lower 95% | Upper 95% | DoF | |
|---|---|---|---|---|
| Unknown | 0.9529 | 0.8789 | 1.0321 | 3 |
| Relative Potency | Lower 95% | Upper 95% | |
|---|---|---|---|
| Unknown | 95.29% | 87.89% | 103.21% |
| Percent CI | Lower 95% | Upper 95% | |
|---|---|---|---|
| Unknown | 100.00% | 92.23% | 108.31% |