9.3.8. Gauge R&R Analysis
Gauge repeatability and reproducibility analysis is designed to ensure stability and consistency of measurements made on an instrument by one or more operators. Repeatability refers to variation in measurements due to the nature of the equipment while reproducibility refers to variation introduced by the operators.
UNISTAT can perform Gauge R&R Analysis employing or Average and Range or Analysis of Variance (ANOVA) methods. Output includes ANOVA table, gauge variances, standard deviations and confidence intervals. Range Chart and Average Chart can be displayed in Stacked or Unstacked form.
9.3.8.1. Gauge R&R Data Preparation
If data is given in the form of a table where measurements corresponding to different parts are in separate columns, it must be transformed into a more convenient format for analysis.
Consider the data given in Figure 12, p. 101 of AIAG (2002), with 3 operators, 3 trials and 10 parts.
|
Oper ator |
|
Part |
|||||||||
|
Trials |
1 |
2 |
3 |
4 |
5 |
6 |
7 |
8 |
9 |
10 |
|
|
|
1 |
0.29 |
-0.56 |
1.34 |
0.47 |
-0.80 |
0.02 |
0.59 |
-0.31 |
2.26 |
-1.36 |
|
A |
2 |
0.41 |
-0.68 |
1.17 |
0.50 |
-0.92 |
-0.11 |
0.75 |
-0.20 |
1.99 |
-1.25 |
|
|
3 |
0.64 |
-0.58 |
1.27 |
0.64 |
-0.84 |
-0.21 |
0.66 |
-0.17 |
2.01 |
-1.31 |
|
|
1 |
0.08 |
-0.47 |
1.19 |
0.01 |
-0.56 |
-0.20 |
0.47 |
-0.63 |
1.80 |
-1.68 |
|
B |
2 |
0.25 |
-1.22 |
0.94 |
1.03 |
-1.20 |
0.22 |
0.55 |
0.08 |
2.12 |
-1.62 |
|
|
3 |
0.07 |
-0.68 |
1.34 |
0.20 |
-1.28 |
0.06 |
0.83 |
-0.34 |
2.19 |
-1.50 |
|
|
1 |
0.04 |
-1.38 |
0.88 |
0.14 |
-1.46 |
-0.29 |
0.02 |
-0.46 |
1.77 |
-1.49 |
|
C |
2 |
-0.11 |
-1.13 |
1.09 |
0.20 |
-1.07 |
-0.67 |
0.01 |
-0.56 |
1.45 |
-1.77 |
|
|
3 |
-0.15 |
-0.96 |
0.67 |
0.11 |
-1.45 |
-0.49 |
0.21 |
-0.49 |
1.87 |
-2.16 |
We need to stack all measurements in a single column and create three categorical data columns (or factors) to keep track of which measurement belongs to which operator, which trial and which part. For a fully specified table we need to end up with four columns in the worksheet, one data and three factor columns, though the last factor column Trial is not used in Gauge R&R Analysis.
In Stand-Alone Mode, Part, Operator and Trial factors can be generated automatically using the UNISTAT spreadsheet functions Level(10), Level(30);B and Level(10);B respectively (see 3.4.2.5. Statistical Functions).
|
Data |
Pt |
Op |
Tr |
|
|
|
|
|
|
|
|
|
|
|
0.29 |
1 |
A |
1 |
|
0.08 |
1 |
B |
1 |
|
0.04 |
1 |
C |
1 |
|
-0.56 |
2 |
A |
1 |
|
-0.47 |
2 |
B |
1 |
|
-1.38 |
2 |
C |
1 |
|
1.34 |
3 |
A |
1 |
|
1.19 |
3 |
B |
1 |
|
0.88 |
3 |
C |
1 |
|
0.47 |
4 |
A |
1 |
|
0.01 |
4 |
B |
1 |
|
0.14 |
4 |
C |
1 |
|
-0.80 |
5 |
A |
1 |
|
-0.56 |
5 |
B |
1 |
|
-1.46 |
5 |
C |
1 |
|
0.02 |
6 |
A |
1 |
|
-0.20 |
6 |
B |
1 |
|
-0.29 |
6 |
C |
1 |
|
0.59 |
7 |
A |
1 |
|
0.47 |
7 |
B |
1 |
|
0.02 |
7 |
C |
1 |
|
-0.31 |
8 |
A |
1 |
|
-0.63 |
8 |
B |
1 |
|
-0.46 |
8 |
C |
1 |
|
2.26 |
9 |
A |
1 |
|
1.80 |
9 |
B |
1 |
|
1.77 |
9 |
C |
1 |
|
-1.36 |
10 |
A |
1 |
|
-1.68 |
10 |
B |
1 |
|
-1.49 |
10 |
C |
1 |
|
0.41 |
1 |
A |
2 |
|
0.25 |
1 |
B |
2 |
|
-0.11 |
1 |
C |
2 |
|
-0.68 |
2 |
A |
2 |
|
-1.22 |
2 |
B |
2 |
|
-1.13 |
2 |
C |
2 |
|
1.17 |
3 |
A |
2 |
|
0.94 |
3 |
B |
2 |
|
1.09 |
3 |
C |
2 |
|
0.50 |
4 |
A |
2 |
|
1.03 |
4 |
B |
2 |
|
0.20 |
4 |
C |
2 |
|
-0.92 |
5 |
A |
2 |
|
-1.20 |
5 |
B |
2 |
|
-1.07 |
5 |
C |
2 |
|
-0.11 |
6 |
A |
2 |
|
0.22 |
6 |
B |
2 |
|
-0.67 |
6 |
C |
2 |
|
0.75 |
7 |
A |
2 |
|
0.55 |
7 |
B |
2 |
|
0.01 |
7 |
C |
2 |
|
-0.20 |
8 |
A |
2 |
|
0.08 |
8 |
B |
2 |
|
-0.56 |
8 |
C |
2 |
|
1.99 |
9 |
A |
2 |
|
2.12 |
9 |
B |
2 |
|
1.45 |
9 |
C |
2 |
|
-1.25 |
10 |
A |
2 |
|
-1.62 |
10 |
B |
2 |
|
-1.77 |
10 |
C |
2 |
|
0.64 |
1 |
A |
3 |
|
0.07 |
1 |
B |
3 |
|
-0.15 |
1 |
C |
3 |
|
-0.58 |
2 |
A |
3 |
|
-0.68 |
2 |
B |
3 |
|
-0.96 |
2 |
C |
3 |
|
1.27 |
3 |
A |
3 |
|
1.34 |
3 |
B |
3 |
|
0.67 |
3 |
C |
3 |
|
0.64 |
4 |
A |
3 |
|
0.20 |
4 |
B |
3 |
|
0.11 |
4 |
C |
3 |
|
-0.84 |
5 |
A |
3 |
|
-1.28 |
5 |
B |
3 |
|
-1.45 |
5 |
C |
3 |
|
-0.21 |
6 |
A |
3 |
|
0.06 |
6 |
B |
3 |
|
-0.49 |
6 |
C |
3 |
|
0.66 |
7 |
A |
3 |
|
0.83 |
7 |
B |
3 |
|
0.21 |
7 |
C |
3 |
|
-0.17 |
8 |
A |
3 |
|
-0.34 |
8 |
B |
3 |
|
-0.49 |
8 |
C |
3 |
|
2.01 |
9 |
A |
3 |
|
2.19 |
9 |
B |
3 |
|
1.87 |
9 |
C |
3 |
|
-1.31 |
10 |
A |
3 |
|
-1.50 |
10 |
B |
3 |
|
-2.16 |
10 |
C |
3 |
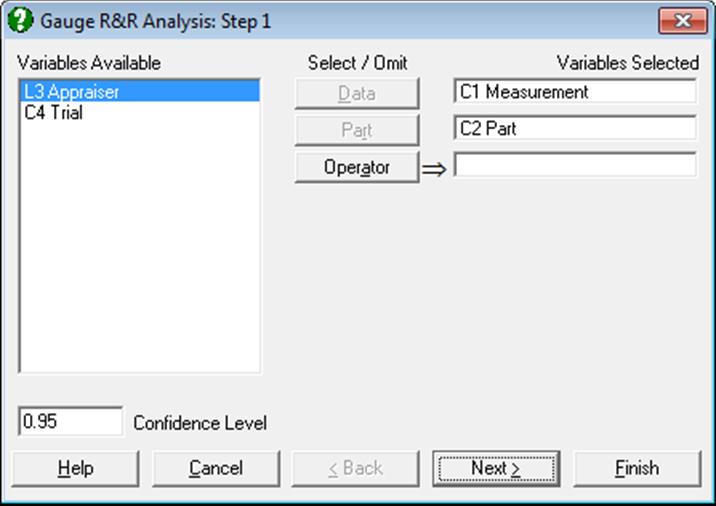
In the Variable Selection Dialogue, the column containing all measurements is selected as [Data] and the factor column containing part numbers is selected as [Part]. These are the two compulsory variables without which an analysis is not possible. If there are two or more operators taking measurements, this information should be provided in the factor column [Operator].
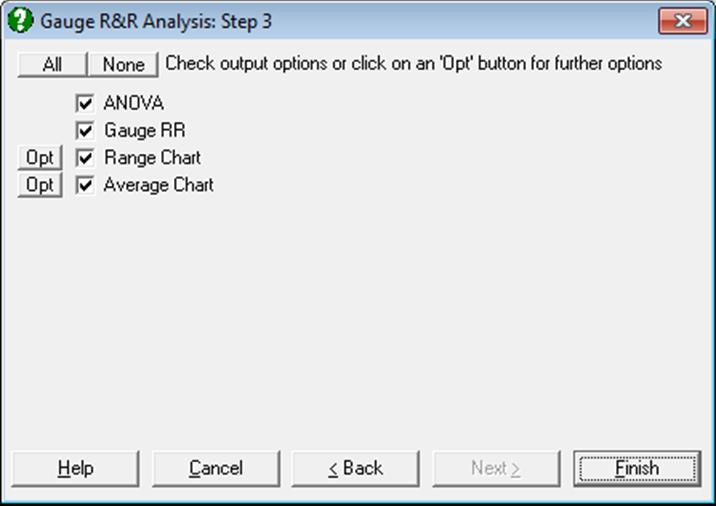
9.3.8.2. Gauge R&R Intermediary Input Options
In step 2 you can define parameters for the analysis and its charts.
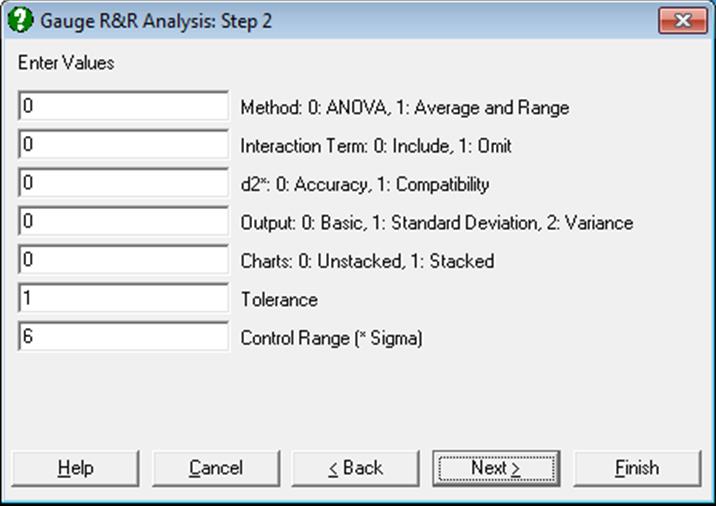
Method: This can be Analysis of Variance (ANOVA) or Average and Range. The ANOVA method is more powerful than Average and Range and it includes confidence intervals.
Interaction Term: When the ANOVA method is selected, you can choose to omit the interaction term between Part and Operator from the analysis. It is advisable to perform the analysis including the interaction term first. If this term in the ANOVA table is highly insignificant (i.e. if it has a high probability), then the analysis can be repeated excluding the interaction term.
d2*: When the Average and Range method is selected, UNISTAT uses accurate unbiasing constants with four significant digits (Appendix C, p. 195, AIAG, 2002). These may, however, generate slightly different results compared with other applications which use less accurate constants with only two significant digits (Table D3, Duncan 1974). You can select here the use of accurate or compatible constants.
Output: When this is Basic, for the Average and Range method, only the study variation is displayed; for the ANOVA method, output also includes the confidence intervals of study variation. When Standard Deviation is selected, output contains standard deviations, percentages and, if the method is ANOVA, confidence intervals for standard deviations. When Variance is selected, standard deviation values are squared.
Charts: Range Chart (R Chart) and Average Chart (X Bar Chart) can be displayed. By default (Unstacked), trials by different operators are represented separately along the X-axis. When the Stacked option is selected, each operator’s data is plotted for the same trial value on the X-axis.
Tolerance: When this value is other than the default value of unity, a % tolerance column is added to the output. % tolerance values are obtained by dividing the study variation by the supplied tolerance value (times 100).
Control Range: The observed process variation in terms of sample standard deviation. This is usually 6, ± 3 sigma around the centre. If the sample is from a normally distributed population, then approximately 99.73% of all data points would fall within this range. Other commonly used values are 5.15 for 99% and 4 for 95% coverage respectively.
9.3.8.3. Gauge R&R Average and Range Method
This method is supported for historical reasons, because it is possible to perform calculations by hand, with the help of some published tables. Where possible, the use of ANOVA method should be preferred.
For Average and Range method and charts we need to find the mean range. The difference between maximum and minimum measurements for each trial and each operator are computed:
![]()
where t is the number of trials. The mean range is then defined as:
![]()
where o is the number of operators and p is the number of parts. Also define the range of operator averages and the range of part averages respectively as:
![]()
![]()
where:
![]()
![]()
Then the output parameters for Average and Range method is calculated as follows.
Repeatability (Equipment Variation):
![]()
Reproducibility (Appraiser Variation):
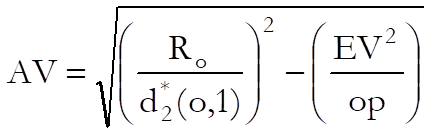
Repeatability & Reproducibility (Gauge R&R):
![]()
Part Variation:
![]()
Total Variation:
![]()
The percentage variation is calculated as 100 x Variation / TV and the number of distinct categories as Int(1.41(PV/RR)).
9.3.8.4. Gauge R&R ANOVA Method
The default model is a balanced two-way ANOVA with interaction. Balanced means each operator measures the same number of parts and the same number of trials. It is possible to omit the interaction term or run a balanced one-way ANOVA when there is one operator only. By default, the following table is displayed.
|
Due To |
Sum of Squares |
DoF |
Mean Square |
F-Stat |
Prob |
|
Part |
SSP |
DFP |
MSP |
FP |
PP |
|
Operator |
SSO |
DFO |
MSO |
FO |
PO |
|
Part x Operator |
SSPO |
DFPO |
MSPO |
FPO |
PPO |
|
Repeatability |
SSR |
DFR |
MSR |
|
|
|
Total |
SST |
DFT |
MST |
|
|
The Mean Square (MS) values from the ANOVA table are used to construct study variation values as follows.
Repeatability (Equipment Variation):
![]()
Reproducibility (Appraiser Variation):
![]()
Interaction:
![]()
Repeatability & Reproducibility (Gauge R&R):
![]()
Part Variation:
![]()
Total Variation:
![]()
The confidence intervals are computed employing the modified large sample method given in Montgomery, D. C. (2009).
The percentage variation is calculated as 100 x Variation / TV and the number of distinct categories as Int(1.41(PV/RR)).
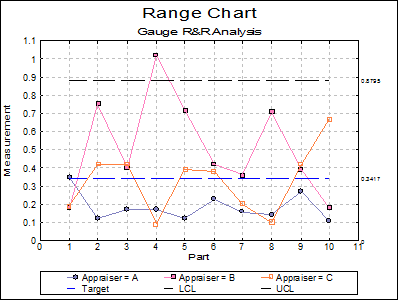
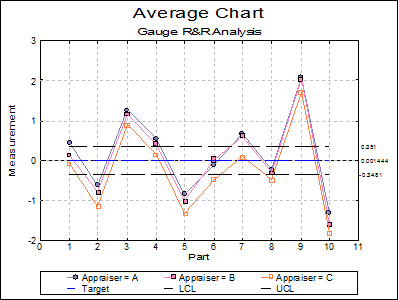
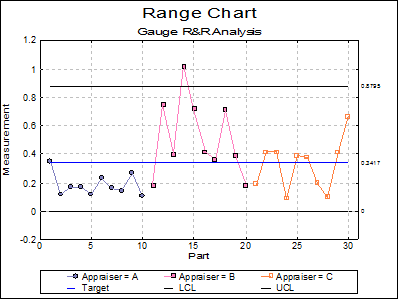
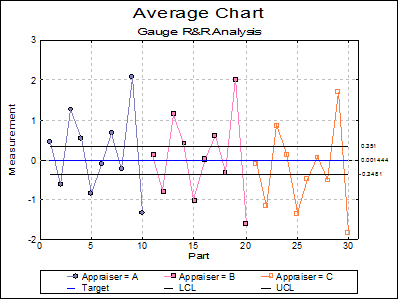
9.3.8.5. Gauge R&R Charts
The two types of charts that can be plotted are Range Chart and Average Chart, which are basically an R Chart and an X Bar Chart for two factor variables respectively. Range Chart is a graphical representation of repeatability and shows the consistency of the gage variability. Average Chart represents reproducibility (or operator variability) and part variation.
For Range Chart, the difference between maximum and minimum measurements are computed for each trial:
Assuming the Control Range is 6, the control limits are found as:
![]()
![]()
![]()
For Average Chart, the overall mean is calculated as:
![]()
And the control limits are:
![]()
![]()
![]()
If the Unstacked option is selected trials by different operators are represented separately along the X-axis. If the Stacked option is selected, each operator’s data is plotted for the same trial value on the X-axis.
9.3.8.6. Gauge R&R Examples
Example 1
Data is given in Figure 12 Gage Repeatability and Reproducibility Data Collection Sheet on p. 101 of AIAG (2002). Note that AIAG (2002) reports standard deviations, rather than the variance or study variation.
Open TIMESER and select Statistics 2 → Quality Control → Gauge R&R Analysis. Select Measurement (C22) as [Data], Part (C23) as [Part] and Appraiser (S24) as [Operator]. On Step 2 enter 1 for Method: Average and Range and leave all other parameters unchanged. On the Output Options Dialogue check all options to obtain the following output.
Gauge R&R Analysis
Gauge RR
Data: Measurement
Part: Part
Operator: Appraiser
Method: Average and Range
Control Range: 6 x Sigma
|
|
Standard Deviation |
% Variation |
Variation |
% Variation |
|
Gauge RR |
0.3058 |
26.68 |
1.8347 |
26.68 |
|
Repeatability EV |
0.2019 |
17.61 |
1.2112 |
17.61 |
|
Reproducibility AV |
0.2297 |
20.04 |
1.3781 |
20.04 |
|
Part PV |
1.1045 |
96.37 |
6.6267 |
96.37 |
|
Total TV |
1.1460 |
100.00 |
6.8760 |
100.00 |
Number of distinct categories: 5
Example 2
Continuing from the last example, on the Variable Selection Dialogue edit the Confidence Level as 0.9, on the second dialogue enter the following parameters and click [Finish].
· 0 Method: ANOVA
· 1 Interaction Term: Omit
· 0 d2* (not used)
· 1 Extended Output: Yes
· 1 Charts: Stacked
· 0.4 Tolerance
· 6 Control Range
Gauge R&R Analysis
ANOVA
Data: Measurement
|
Due To |
Sum of Squares |
DoF |
Mean Square |
F-Stat |
Prob |
|
Part |
88.362 |
9 |
9.818 |
245.614 |
0.0000 |
|
Operator |
3.167 |
2 |
1.584 |
39.617 |
0.0000 |
|
Repeatability |
3.118 |
78 |
0.040 |
|
|
|
Total |
94.647 |
89 |
1.063 |
|
|
Gauge RR
Data: Measurement
Part: Part
Operator: Appraiser
Method: ANOVA
Tolerance: 0.4
Control Range: 6 x Sigma
|
|
Standard Deviation |
Lower 90% |
Upper 90% |
% Variation |
|
Gauge RR |
0.3024 |
0.2351 |
1.0334 |
27.86 |
|
Repeatability EV |
0.1999 |
0.1769 |
0.2306 |
18.42 |
|
Reproducibility AV |
0.2268 |
0.1275 |
1.0138 |
20.90 |
|
Part PV |
1.0423 |
0.7588 |
1.7170 |
96.04 |
|
Total TV |
1.0853 |
0.8161 |
1.8111 |
100.00 |
|
|
Variation |
Lower 90% |
Upper 90% |
% Variation |
% Tolerance |
|
Gauge RR |
1.8142 |
1.4107 |
6.2002 |
27.86 |
453.56 |
|
Repeatability EV |
1.1996 |
1.0615 |
1.3834 |
18.42 |
299.90 |
|
Reproducibility AV |
1.3610 |
0.7653 |
6.0827 |
20.90 |
340.26 |
|
Part PV |
6.2540 |
4.5529 |
10.3021 |
96.04 |
1563.49 |
|
Total TV |
6.5118 |
4.8966 |
10.8667 |
100.00 |
|
Number of distinct categories: 4