6.3.3. Normality Tests
Four commonly used tests of normality can be performed; Shapiro-Wilk, Kolmogorov-Smirnov, Cramer-von Mises and Anderson-Darling. The test statistics are displayed with their probability values and optionally, with basic sample statistics (number of cases, mean and standard deviation). The latter three tests (Kolmogorov-Smirnov, Cramer-von Mises and Anderson-Darling) are also known as EDF tests since they are based on the Empirical Distribution Function (EDF). These tests are based on the assumption that population mean and standard deviation are not known and are to be estimated from the data. Without this assumption the probability values may be quite different. See Stephens, M. A. (1974), (1986).
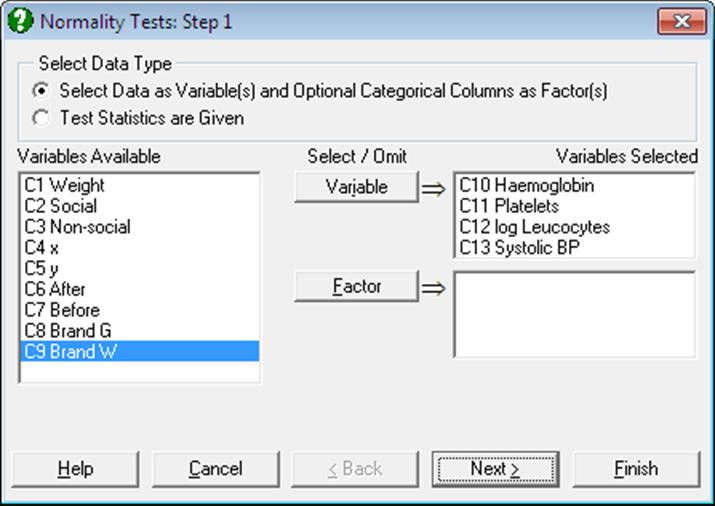
Multisample data can be entered either in the form of multiple columns (not necessarily of equal length) or data columns classified by one or more factor columns (see 6.0.4. Multisample Tests). If at least one factor column is selected, then a further dialogue will pop up asking for the combination of factor levels to be included.
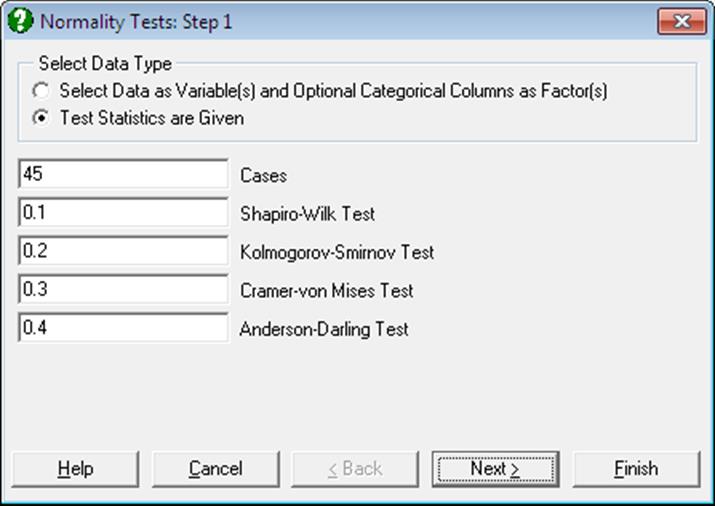
It is also possible to use this procedure as a probability calculator when the data is not available but the number of cases and the test statistics are known.
On the Output Options Dialogue, you can select only the desired test statistics and their probabilities to be displayed in the output. It is also possible to display a Normal Probability Plot for the selected variables. The Anderson-Darling Test probability is also reported on the graph. For further information see 5.3.2. Normal Probability Plot
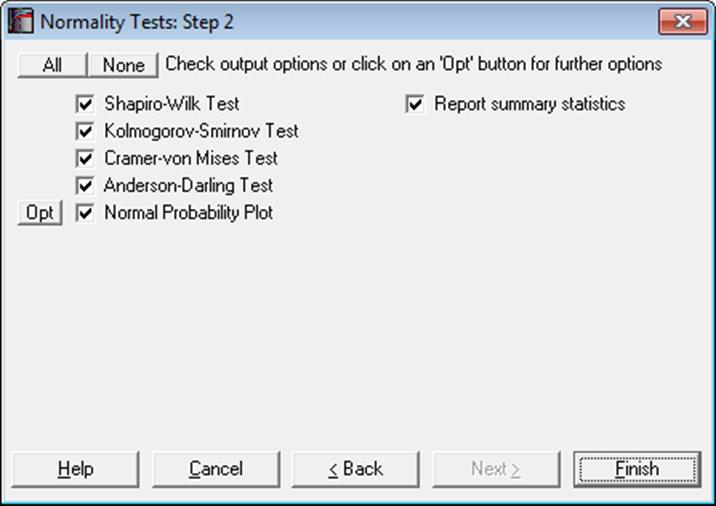
When the Report summary statistics box is checked, summary information (number of valid cases, missing observations, mean and standard deviation) about the selected variables is also displayed.
6.3.3.1. Shapiro-Wilk Test
The test statistic and its probability value are computed according to Royston (1995), which works accurately for samples with 3 to 5000 observations:
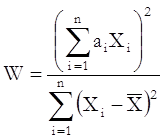
where ai are some coefficients dependent on the sample size.
Earlier versions of UNISTAT also featured the classic Shapiro-Wilk (1965) normality test for samples with 50 or less observations and an overall test of normality by Shapiro & Wilk (1968), when all sample sizes are between 7 and 20 inclusive.
6.3.3.2. Kolmogorov-Smirnov Test
The difference between cumulative proportions of the sample and the corresponding cumulative proportions from the normal distribution are computed and the absolute value of their maximum difference is reported (see 6.3.2. Kolmogorov-Smirnov Tests):
![]()
where cpoi and cpei are the ith observed and normal cumulative proportions respectively.
The probability value for this test is computed according to Lilliefors (1967), with the correction introduced by Dallal and Wilkinson (1986). The maximum probability value that can be computed is 0.2. Therefore, when the probability value is reported as 0.2, this should be interpreted as probability ≥ 0.2.
6.3.3.3. Cramer-von Mises Test
For a one sample case, where population mean and standard deviation are not known, but are estimated from the data, the Cramer-von Mises test statistic is defined as:
![]()
6.3.3.4. Anderson-Darling Test
For a one sample case, where population mean and standard deviation are not known, but are estimated from the data, the Anderson-Darling test statistic is defined as:
![]()
6.3.3.5. Normality Plots
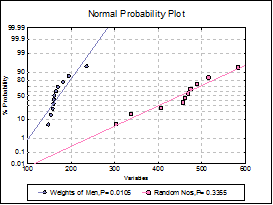
Multiple data series can be drawn with a line of best fit on a graph with a probit scale Y-axis against a linear X-axis. All aspects of the graph can be edited and customised by clicking on the [Opt] button situated to the left of this output option.
If the data lies on a near-straight line, then it is said to conform to the normal distribution. By default, an Anderson-Darling Test of normality is also performed for each series and its tail probability is reported in the legend. Smaller p-values indicate non-normality.
For details see section 5.3.2. Normal Probability Plot.
Example
The two samples given here are taken from Shapiro, S. S. and M. B. Wilk. (1965), p. 606.
Open GOODFIT, select Statistics 1 → Goodness of Fit Tests → Normality Tests and Weights of Men (C5) and Random Nos (C6) as [Variable]s to obtain the following results:
Normality Tests
Smaller probabilities indicate non-normality.
|
|
Valid Cases |
Missing |
Mean |
Standard Deviation |
Shapiro-Wilk |
Prob |
|
Weights of Men |
11 |
0 |
172.0000 |
24.9520 |
0.7888 |
0.0067 |
|
Random Nos |
10 |
0 |
449.5000 |
82.0762 |
0.9427 |
0.5831 |
|
|
Kolmogorov-Smirnov |
Prob |
Cramer-von Mises |
Prob |
Anderson-Darling |
Prob |
|
Weights of Men |
0.2592 |
0.0374 |
0.1639 |
0.0125 |
0.9468 |
0.0105 |
|
Random Nos |
0.2364 |
0.1163 |
0.0718 |
0.2377 |
0.3775 |
0.3355 |