6.3.2. Kolmogorov-Smirnov Tests
One sample and two sample Kolmogorov-Smirnov Tests can be accesses under one menu item and the results are presented in a single page of output.
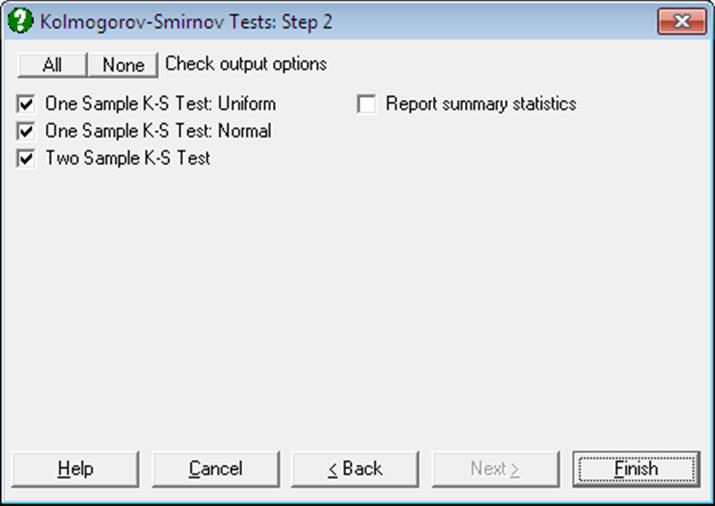
If you wish to perform a one sample Kolmogorov-Smirnov test, you can select only one variable. If you select two or more variables, then two separate one sample tests will be performed on each variable, alongside a two sample test between them. Output Options Dialogue will allow you to choose which tests to appear in the output.
When the Report summary statistics box is checked, summary information about the selected variables (number of valid and missing cases, mean and standard deviation) is also displayed.
6.3.2.1. One Sample Kolmogorov-Smirnov Test: Uniform Distribution
The null hypothesis “the cumulative distribution of the observed set of data is uniform” is tested. It is assumed that the underlying distribution is continuous. The program computes cumulative proportions from the sample and finds the absolute value of their maximum difference from the cumulative uniform distribution (i.e. the Kolmogorov-Smirnov statistic).
![]()
where cpoi and cpei are the ith observed and uniform cumulative proportions respectively.
The output includes the test statistic and its two-tailed probability (which is computed from the Smirnov formula).
Example
Example 3.4 on pp. 72-74 from Sprent, P. (1993), where the null hypothesis “the population is uniformly distributed” is tested at a 95% confidence level.
Open GOODFIT and select Statistics 1 → Goodness of Fit Tests → Kolmogorov-Smirnov Tests. Select Distance (C4) as [Variable] and check One Sample K-S Test: Uniform and Report summary statistics boxes to obtain the following results:
Kolmogorov-Smirnov Tests
For Distance
|
|
Valid Cases |
Missing |
Mean |
Standard Deviation |
|
Distance (Uniform) |
20 |
0 |
2.7350 |
1.5246 |
|
|
Abs(Maximum difference) |
Test Statistic |
2-Tail Probability |
Lilliefors Probability |
|
Distance (Uniform) |
0.2217 |
0.9915 |
0.2793 |
|
Since the probability is larger than 5%, do not reject the null hypothesis.
6.3.2.2. One Sample Kolmogorov-Smirnov Test: Normal Distribution
This is similar to Kolmogorov-Smirnov test for uniform distribution except that the observed cumulative proportions are compared with the normal cumulative proportions.
The two-tailed probability value computed from Smirnov formula is reported. An alternative probability definition by Lilliefors (1967), adopting the correction introduced by Dallal and Wilkinson (1986), is also reported. The probability values from Smirnov and Lilliefors formulas can be quite different. The Smirnov probability should only be used when the population mean and standard deviation are known and the Lilliefors probability should be used when these entities are to be estimated from data.
One sample Kolmogorov-Smirnov test for normality with this latter probability value is also known as Lilliefors test. Lilliefors probability values are also reported as part of Normality Tests output for Kolmogorov-Smirnov test.
Example
Example 3.6 on pp. 77-79 from Sprent, P. (1993), where the null hypothesis “the population death age is normally distributed” is tested.
Open GOODFIT and select Statistics 1 → Goodness of Fit Tests → Kolmogorov-Smirnov Tests. Select Age (C7) as [Variable], check only the One Sample K-S Test: Normal box to obtain the following results:
Kolmogorov-Smirnov Tests
For Age
|
|
Abs(Maximum difference) |
Test Statistic |
2-Tail Probability |
Lilliefors Probability |
|
Age (Normal) |
0.1921 |
1.0522 |
0.2182 |
0.0062 |
The null hypothesis is rejected at the 99% confidence level. UNISTAT reports the exact probability while Sprent compares the test statistic with the published critical value for 1%.
6.3.2.3. Two Sample Kolmogorov-Smirnov Test
Cumulative distributions computed from the two given data sets are compared. The test statistic is:
![]()
where:
![]()
and cp1i and cp2i are the ith cumulative proportions of the first and second samples respectively.
Data in one of the three types supported for two sample tests can be entered (see 6.0.2. Two Sample Tests). The output includes the number of cases in two samples, the maximum difference, the test statistic, its two-tailed probability from the Smirnov distribution.
If the last data option is selected, the program will prompt for the number of cases in each sample and the maximum absolute cumulative difference. It is possible to use this procedure to calculate the cumulative Smirnov distribution probabilities without having to perform the test itself.
Example
Open GOODFIT and select Statistics 1 → Goodness of Fit Tests → Kolmogorov-Smirnov Tests. Select Distance (C4) and Age (C7) as [Variable]s and check all boxes on the output options dialogue.
Kolmogorov-Smirnov Tests
For Distance and Age
|
|
Valid Cases |
Missing |
Mean |
Standard Deviation |
|
Distance (Uniform) |
20 |
0 |
2.7350 |
1.5246 |
|
Age (Uniform) |
30 |
0 |
61.4333 |
25.0430 |
|
Distance (Normal) |
20 |
0 |
2.7350 |
1.5246 |
|
Age (Normal) |
30 |
0 |
61.4333 |
25.0430 |
|
Distance – Age |
|
|
|
|
|
|
Abs(Maximum difference) |
Test Statistic |
2-Tail Probability |
* Lilliefors Probability |
|
Distance (Uniform) |
0.2217 |
0.9915 |
0.2793 |
|
|
Age (Uniform) |
0.3182 |
1.7428 |
0.0046 |
|
|
Distance (Normal) |
0.1112 |
0.4975 |
0.9655 |
0.2000 |
|
Age (Normal) |
0.1921 |
1.0522 |
0.2182 |
0.0062 |
|
Distance – Age |
1.0000 |
3.4641 |
0.0000 |
|
* Lilliefors probability = 0.2 means 0.2 or greater.