5.3.1. Box-Whisker, Dot and Bar Plots
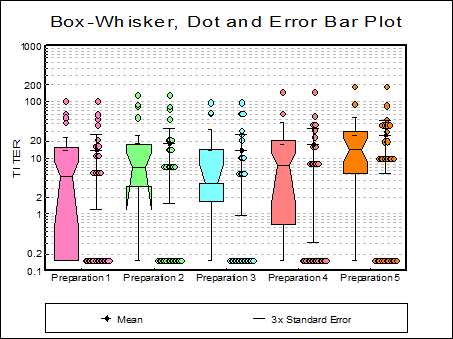
This procedure combines boxplot with dot and error bar plots. Multisample data can be entered in the form of multiple columns or data columns classified by factor columns. If at least one factor is selected, then a further dialogue will pop up asking for the combination of factor levels to be included. The data is plotted on the Y-axis (where the Scale Type can be one of linear, log base 10, log base e, log based to any user-defined value, logit, probit, gompit (cloglog) or loglog and the categories on the X-axis. Although an unlimited number of data series can be plotted, properties of only the first nine can be individually controlled on the Data Series dialogue that can be accessed either from the Edit → Data Series menu or by double-clicking on the graph area. The rest of the series will repeat the properties of the first nine in a circular fashion. The Apply to all variables check box allows you to apply the current variable’s settings to all selected variables.
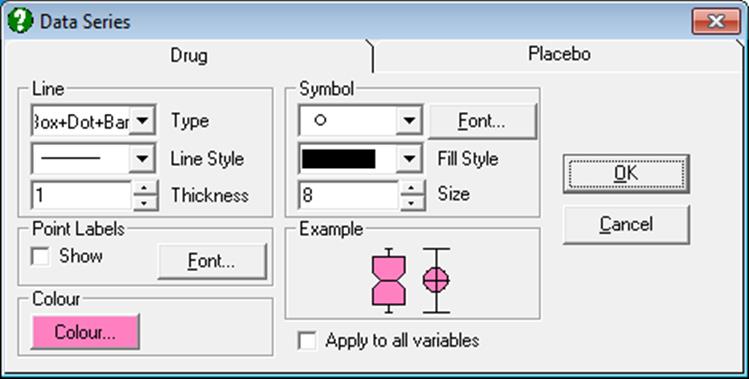
Symbol type, symbol size, colour and Point Labels can be controlled for outlying points on Box and Whisker Plot for each data series individually.
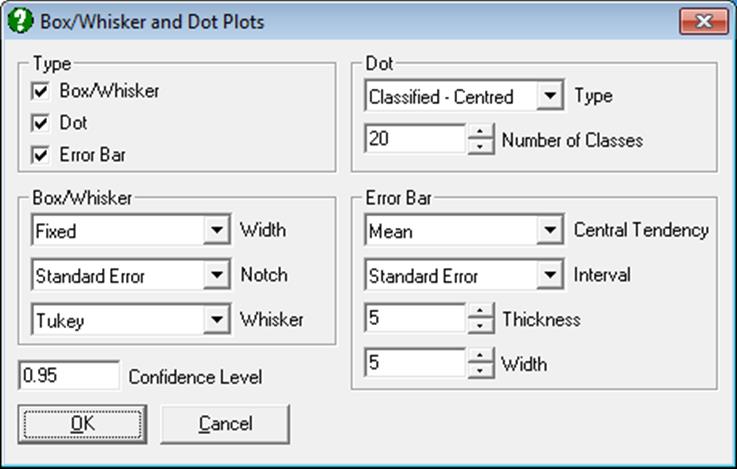
The Edit → Width / Notch / Dots dialogue can be used to control the statistical parameters represented on the graph. The three check boxes in the Type panel allow drawing any combination of Box and Whisker Plot, Dot Plot and Error Bar Plot on the same graph. The other three frames on this dialogue are used to control the individual characteristics of each type of plot. The Confidence Level text box is included in this dialogue for the sake of convenience, although it is also available in the Variable Selection Dialogue. Changes made on this dialogue will apply to all data series.
5.3.1.1. Box and Whisker Plot
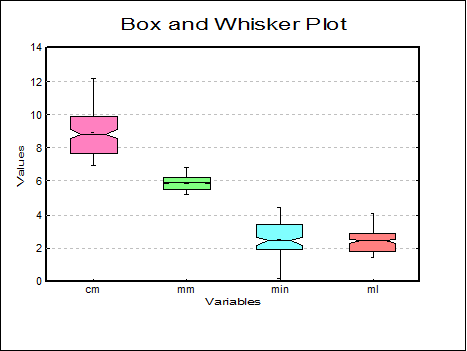
A box and whisker plot conveys the following information:
Bottom of the box: Lower quartile.
Middle of the box: Median.
Top of the box: Upper quartile.
Box Width: The variable box width conveys information about the size of the sample. See below.
Notch: When there is a notch, it conveys information about the dispersion of data about the median. See below.
Lower Whisker: Lower adjacent value. Any values below this are outliers and are plotted individually. See below for alternative methods.
Upper Whisker: Upper adjacent value. Any values above this are outliers and are plotted individually. See below for alternative methods.
On the Width / Notch / Dots dialogue, the first group of controls concerns the Box and Whisker plots.
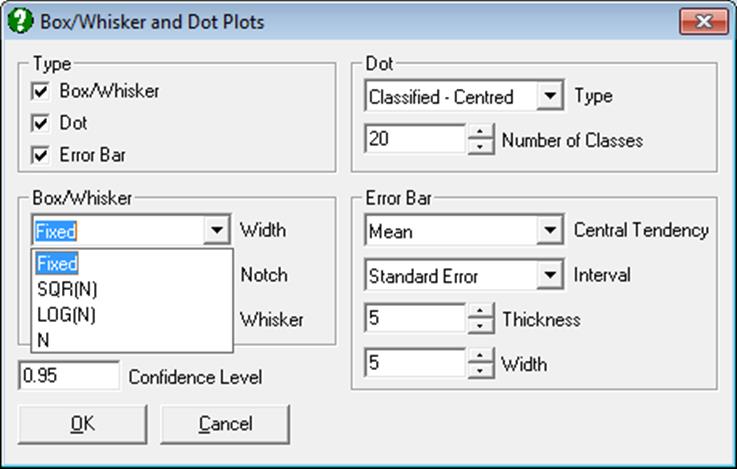
Width: The width of boxes can be used to convey information about sample sizes:
Fixed: No size information.
Sqr(n): The widths are proportional to the square root of their sample size.
Log(n): The widths are proportional to the 10 based logarithm of their sample size.
n: The widths are proportional to their sample size.
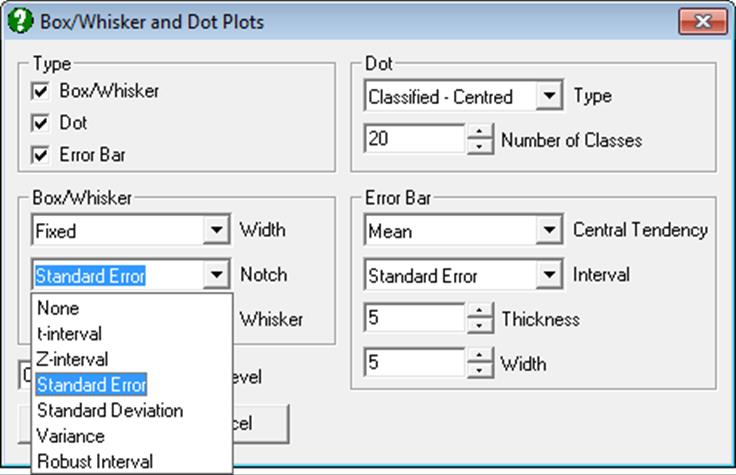
Notch: The extent of notches represents the following dispersion measures:
None: A notch is not drawn.
t-interval:
![]()
![]()
where ![]() is the
critical value from t-distribution with n – 1 degrees of freedom.
is the
critical value from t-distribution with n – 1 degrees of freedom.
Z-interval:
![]()
![]()
Standard Error:
![]()
![]()
Standard Deviation: As above, but with sample standard deviation.
![]()
![]()
Variance: As above, but with sample variance.
![]()
![]()
Robust Confidence Interval: The robust standard error (SE*) is defined as:
![]()
where IQR is the inter-quartile range and n is the sample size. The robust confidence interval is then defined as:
![]()
![]()
where ![]() is the
critical value from the standard normal distribution (see McGill, R., Tukey, J. W. and Larsen, W. A. 1978).
is the
critical value from the standard normal distribution (see McGill, R., Tukey, J. W. and Larsen, W. A. 1978).
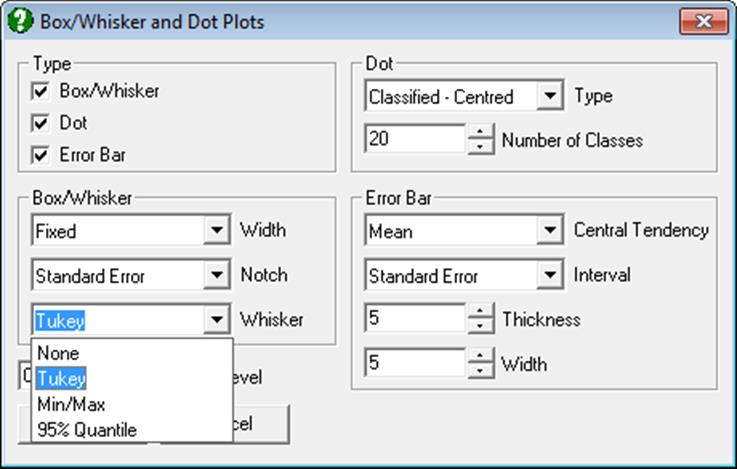
Whiskers: These convey information about the dispersion of data. Any values remaining outside the extent of whiskers are called outliers.
None: No whiskers and outliers are plotted.
Tukey: This is he default method. The lower whisker corresponds to the maximum of (i) lower quartile minus 1.5 times the inter-quartile range and (ii) the minimum observation and the upper whisker to the minimum of (i) upper quartile plus 1.5 times the inter-quartile range and (ii) the maximum observation.
Min / Max: Whiskers correspond to the minimum and maximum of data series.
Quantiles: Whiskers correspond to the lower and upper 95% quantiles by default. The significance level can be changed by the user.
5.3.1.2. Dot Plot
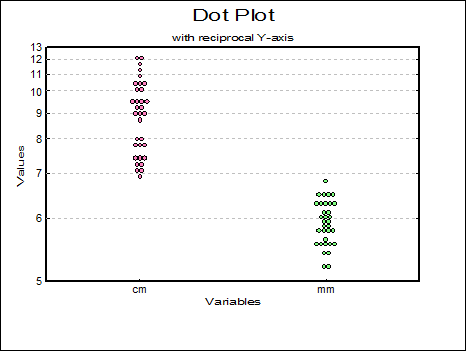
The second frame contains controls for dot plots.
Type: The dots can be plotted in four different ways. The first two options will classify the observations into a specified number of classes, like in a histogram. The latter two options will plot the dots at their actual values, rather than classifying them into groups.
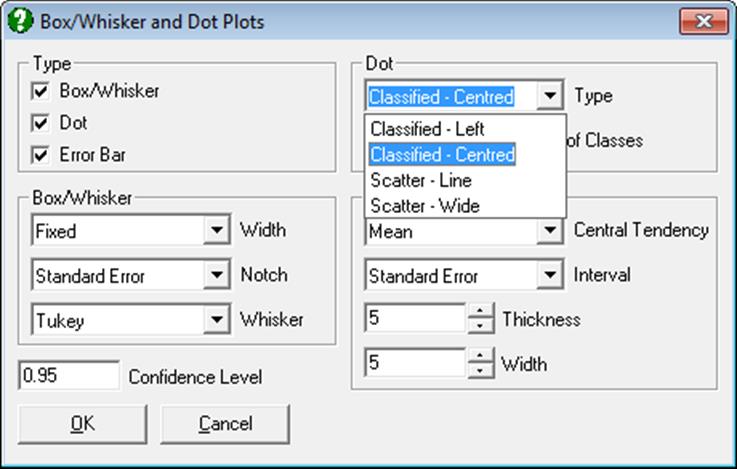
Classified – left: Observations will be classified into groups and the dots will be left-justified.
Classified – centred: Observations will be classified into groups and the dots will be centred.
Scatter – line: The actual values of observations will be plotted along a vertical line.
Scatter – wide: The actual values of observations will be plotted and the overlapping dots will be separated as much as possible.
Number of Classes: The classified dot plots are essentially histograms and this parameter controls the number of classes (the default is 20). The size of dots can be adjusted from the Edit → Data Series → Symbol panel to obtain the desired appearance.
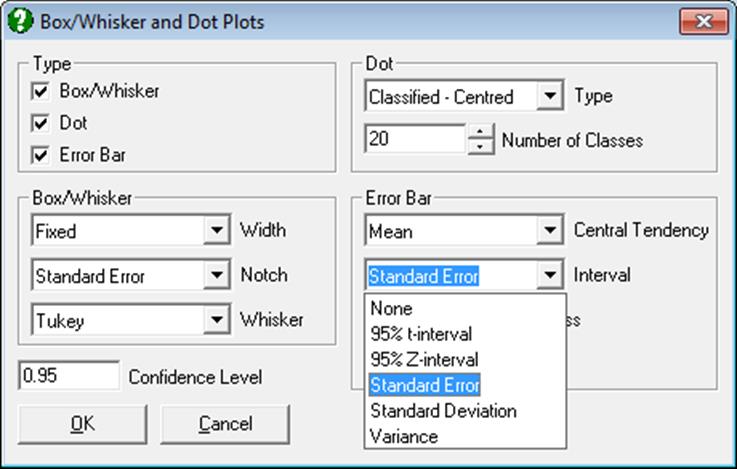
5.3.1.3. Error Bar Plot
Central Tendency and Confidence Interval: The following central tendency measures and their confidence limits can be drawn.
· Mean
· t-interval
· Z-interval
· Standard Error
· Standard Deviation
· Variance
· Geometric Mean
· t-interval
· Z-interval
· Harmonic Mean
· t-interval
· Z-interval
· Median
· Quartiles
· 95% Quantile
· Robust Confidence Interval
When Central Tendency is Mean and one of Standard Error or Standard Deviation options is selected, a dialogue pops up asking for a multiplier.
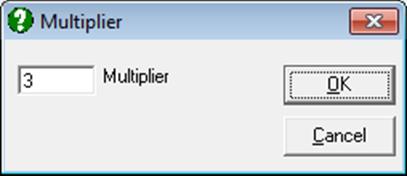
Error bars for standard error will then be calculated as:
![]()
![]()
and for standard deviation:
![]()
![]()
where k is the multiplier defined by the user.