10.5. Combination of Assays
Geometric / arithmetic mean potencies and their confidence limits are calculated from two or more assay results. Semi-weighted means can be computed according to European Pharmacopoeia (1997-2017) and United States Pharmacopoeia (2009).
It is also possible to run multiple assays and to combine their results in one go. See section 10.0.4. Multiple Assays with Combination.
10.5.1. Combined Potency Variable Selection
As of this version of UNISTAT, we provide two data options for combining assay results; Confidence Limits are Given and Only Potencies are Given. There is also a new optional [Preparation] variable which enables the user to combine potencies separately for each preparation.
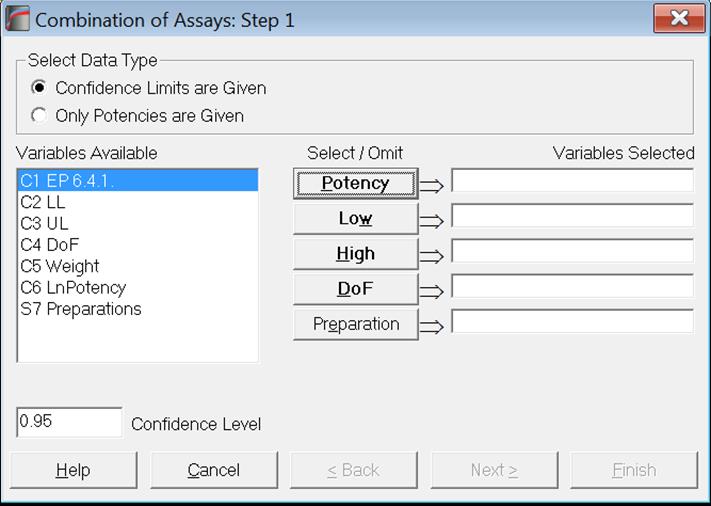
Both European Pharmacopoeia (1997-2017) and United States Pharmacopoeia (2009) recommend combining potencies together with their confidence limits. For the first data option Confidence Limits are Given, potencies, their lower and upper limits and the assay degrees of freedom should be entered in separate columns and they are selected for analysis by clicking on [Potency], [Low], [High] and [DoF] respectively. All four variables are compulsory. If the optional [Preparation] variable is also selected, potencies will be combined separately for each preparation.
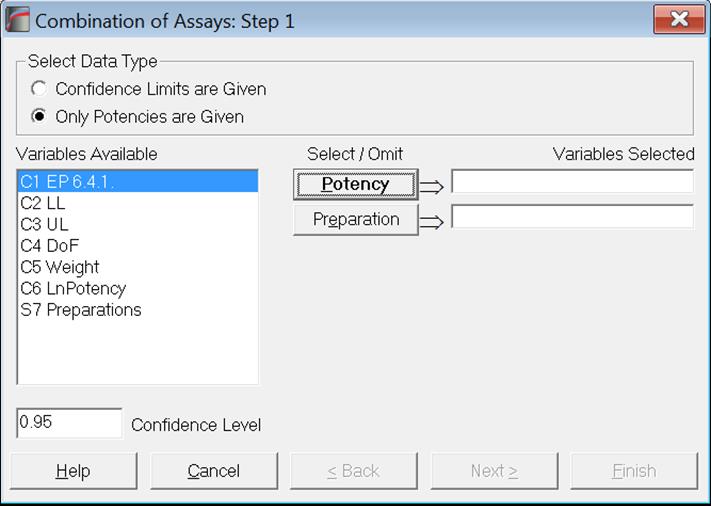
Only Potencies are Given data option will be useful for those who still use legacy systems where only data on potencies is available, with no information on their confidence limits or degrees of freedom. It is sufficient to select one column of data where the potency values are stacked and if the optional [Preparation] variable is also selected, potencies will be combined separately for each preparation.
10.5.2. Combined Potency Output Options
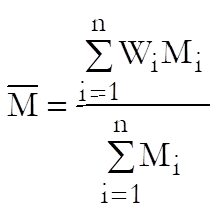
Usually, arithmetic means are calculated for Slope Ratio Method and geometric means for Parallel Line Method, Quantal Response Method and Four-Parameter Logistic Model. If the geometric means are to be computed, all potencies and their confidence limits are logged first. The results are anti-logged before they are displayed.
Let us remember here that when multiple assays are run with the selection of an [Assay] variable, their results will be combined automatically, calling the current procedure. See section 10.0.4. Multiple Assays with Combination. The user should take care that the correct averaging method was selected prior to running multi-assay tasks. In certain cases it may be necessary to use arithmetic means for Quantal Response Method or Four-Parameter Logistic Model; for instance, when the dose values are already logged. Also, if there is more than one unknown sample in a multi-assay run, you can combine potencies for each sample separately by checking the Combine Samples Separately box. Otherwise potencies from all samples and all assays will be combined together.
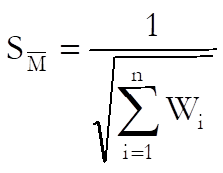
Weights are computed using confidence limits of each estimated potency:
![]()
where the t-statistic has the same degrees of freedom as it was used in calculating the potency.
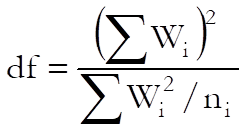
10.5.2.1. Combined Potency Homogeneity Tests
Homogeneity of Means
The following chi-square statistic is calculated:
![]()
with n – 1 degrees of freedom and n is the number of valid assays combined. If the probability value displayed is greater than the given significance level (usually 0.05) then the test is said to be satisfactory.
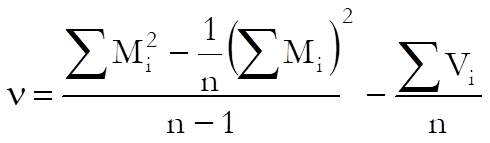
Homogeneity of Variances: Bartlett’s Chi-Square Test
The variance of each potency to be combined is:
![]()
The chi-square statistic is computed as:
![]()
where:
![]()
![]()
ni is the degrees of freedom for each assay and N is the sum of ni. Next, the following term is computed:
![]()
and the test statistic is obtained as:
![]()
which is approximately chi-square distributed with n – 1 degrees of freedom. If the probability value displayed is greater than the given significance level (usually 0.05) then the test is said to be satisfactory.
10.5.2.2. Combined Potency EP
European Pharmacopoeia (1997-2017) describes calculations for weighted, semi-weighted and unweighted means. The Weighted Mean Potency method (which is more robust) should be used if:
1) Homogeneity of means test is satisfactory,
2) Bartlett’s homogeneity of variance test is satisfactory and
3) g < 1 for each assay.
If one or more of these criteria fail, the Unweighted Mean Potency results can be used.
Weighted Mean Potency EP
The weighted mean potency is defined as:
Standard error of weighted mean potency is defined as:
Confidence limits are:
![]()
where the degrees of freedom for the t-statistic is the sum of the number of degrees of freedom for the error mean squares in the individual assays (ni).
Semi Weighted Mean Potency EP
When the chi-square test for combined mean potency has a value p ≥ α, semi weighted mean potency can be used. The variance of the heterogeneity between assays is calculates as:
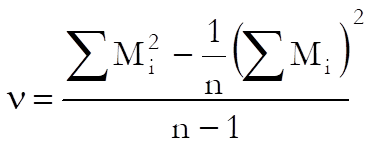
where:
![]()
A semi weight is then defined as:
![]()
The semi weighted mean potency and its confidence interval is then calculated as in the Weighted Mean Potency.
Unweighted Mean Potency
This is defined as the arithmetic mean of individual assay potencies:
![]()
and its variance is:
![]()
The confidence limits of the unweighted mean potency are then:
![]()
where the degrees of freedom for the t-statistic is n – 1.
10.5.2.3. Combined Potency USP
Weighted Mean Potency USP
USP <111> (US Pharmacopoeia, 2009) computes the weighted mean potency as shown above for EP, however it differs in the definition of its confidence interval.
USP adds a correction term to the standard error of weighted mean potency as follows:
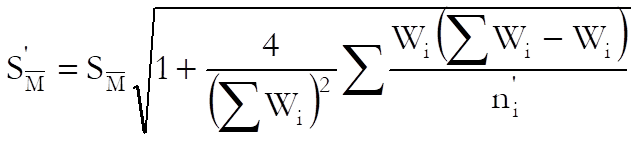
where:
![]()
The confidence limits of the weighted mean potency are:
![]()
where the degrees of freedom for the t-statistic is:
Semi Weighted Mean Potency USP
When the chi-square test for combined mean potency has a value p ≥ α, USP advises use of semi weighted mean potency. The variance of the heterogeneity between assays is calculates as:
where the variance is:
![]()
If ν < 0, then it is re-calculated by omitting the term following the minus sign. A semi weight is then defined as:
![]()
Unweighted Mean Potency
This is the same as in EP.
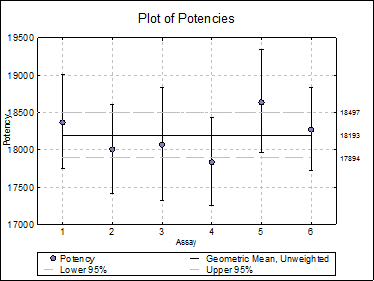
10.5.2.4. Plot of Potencies
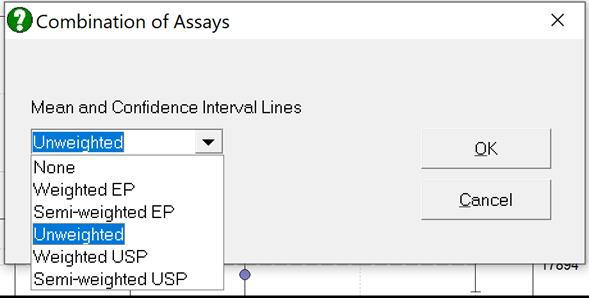
Potencies (as data points) and confidence limits (as error bars) are plotted. As of this version the combined potency and its confidence limits are also plotted as horizontal lines.
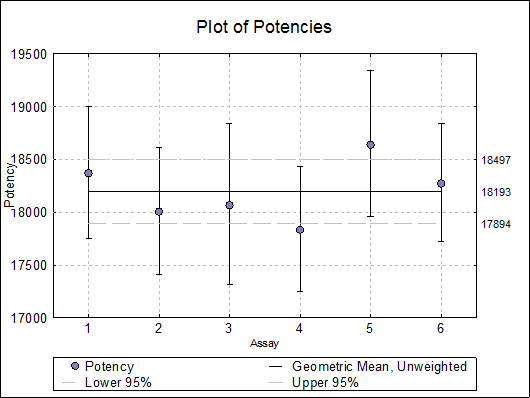
Selecting Edit → Plot of Potencies… will pop a dialogue where the method of combination displayed on the plot can be selected.
10.5.3. Combined Potency Example
Data is given in Table 6.4.1.-I on p. 4375 of European Pharmacopoeia (9th Edition).
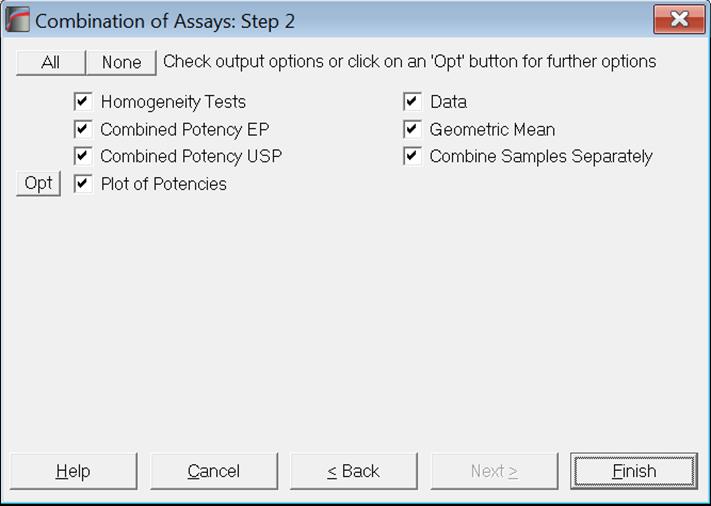
Open BIOPHARMA9 and select Bioassay → Combination of Assays. From the Variable Selection Dialogue select column C48 Potency as [Potency], C49 LL as [Low], C50 UL as [High] and C51 as [DoF]. Click [Next] to proceed to Output Options Dialogue. Check all output options and click [Finish] to obtain the following output.
Combination of Assays
Data
|
Assay |
Potency |
Lower 95% |
Upper 95% |
DoF |
|
1 |
18367.0000 |
17755.0000 |
19002.0000 |
20 |
|
2 |
18003.0000 |
17415.0000 |
18610.0000 |
20 |
|
3 |
18064.0000 |
17319.0000 |
18838.0000 |
20 |
|
4 |
17832.0000 |
17253.0000 |
18429.0000 |
20 |
|
5 |
18635.0000 |
17959.0000 |
19339.0000 |
20 |
|
6 |
18269.0000 |
17722.0000 |
18834.0000 |
20 |
Homogeneity Tests
|
|
Chi-Square |
DoF |
Probability |
Pass/Fail |
|
Mean |
4.419 |
5 |
0.4907 |
Pass |
|
Variance |
2.598 |
5 |
0.7616 |
Pass |
Combined Potency EP
|
Geometric Mean |
Potency |
Lower 95% |
Upper 95% |
|
Weighted EP |
18186.8537 |
17946.0755 |
18430.8624 |
|
Semi-weighted EP |
18187.7481 |
17926.1824 |
18453.1304 |
|
Unweighted |
18193.1071 |
17894.1048 |
18497.1056 |
Combined Potency USP
|
Geometric Mean |
Potency |
Lower 95% |
Upper 95% |
|
Weighted USP |
18186.8537 |
17923.4957 |
18454.0813 |
|
Semi-weighted USP |
18190.0887 |
17855.8964 |
18530.5359 |
|
Unweighted |
18193.1071 |
17894.1048 |
18497.1056 |
|
Standard Deviation (Log base e) = |
0.0158 |
|
Unweighted Mean (Log base e) = |
9.8088 |
|
%RSD = |
0.16% |