8.8.2. Rectangular Plot
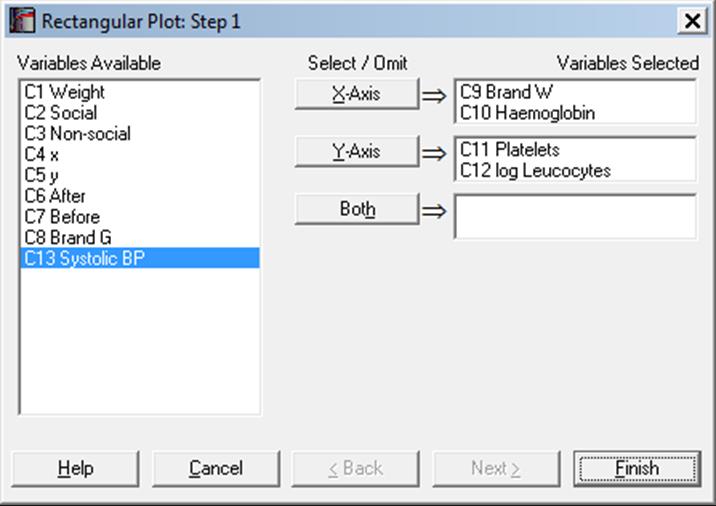
This draws multiple scatter plots in a matrix format, which resembles the Matrix Plot above. However in Rectangular Plot, variables are selected for the [X Axis], [Y Axis] or [Both]. Variables selected for both axes appear on both the X-axis and the Y-axis. All the variables on the X-axis are plotted against all the variables on the Y-axis. A histogram is drawn in the first column and the first row for each variable. In the remaining cells of the matrix, a scatter plot of the two variables is drawn. If a variable is selected as [Both], it will appear on both axes and will also be plotted against itself. When this happens, all the points will lie on a straight line.
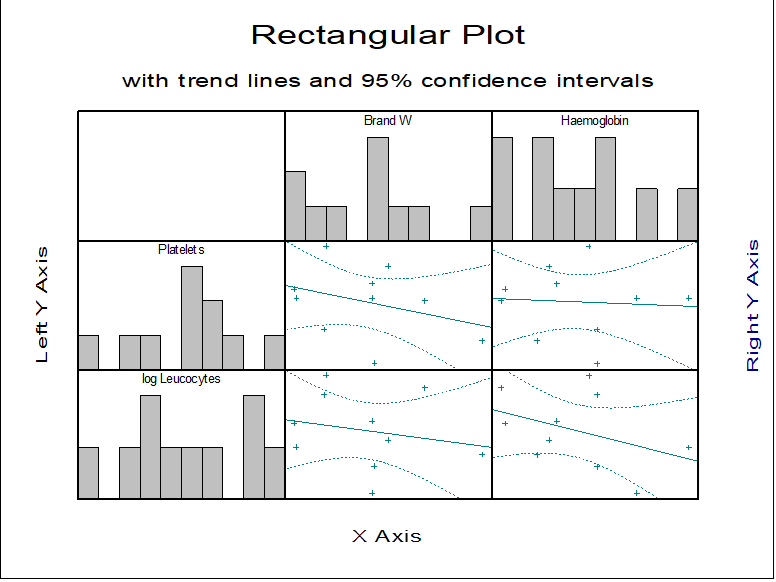
The Edit → Lines dialogue can be used to connect x-y points with lines or to fit a trend line on data with optional confidence intervals. The usual Symbol panel can be used to select any symbols in any colour. The Edit → Bars dialogue can be used to change the colour or filling patterns of the histogram bars.