8.8.1. Matrix Plot
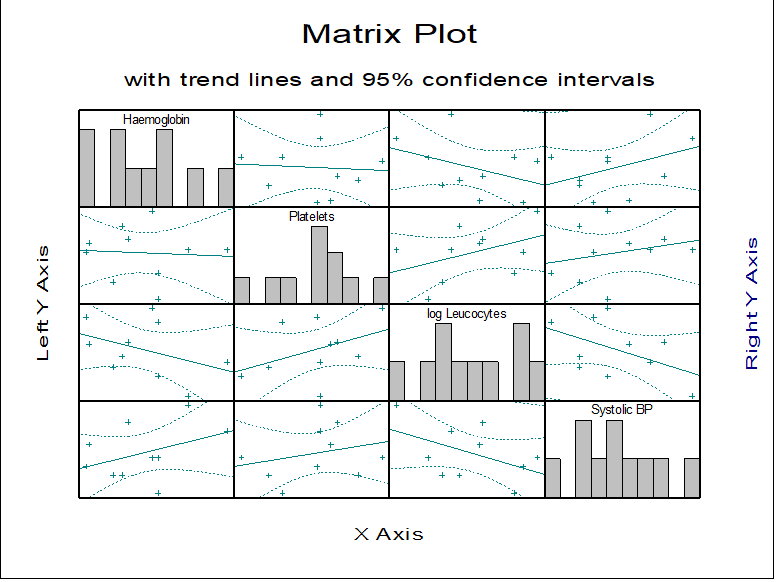
The Matrix Plot procedure draws n(n – 1) scatter plots and n histograms for n selected variables. The variables are selected from the Variable Selection Dialogue by clicking on [Variable]. All combinations of the selected variables are plotted against each other. Down the diagonal of the matrix, where each variable is matched with itself, a histogram of the variable is drawn and its label is printed. Where each variable is matched with a different variable then a scatter plot of the two variables is drawn.
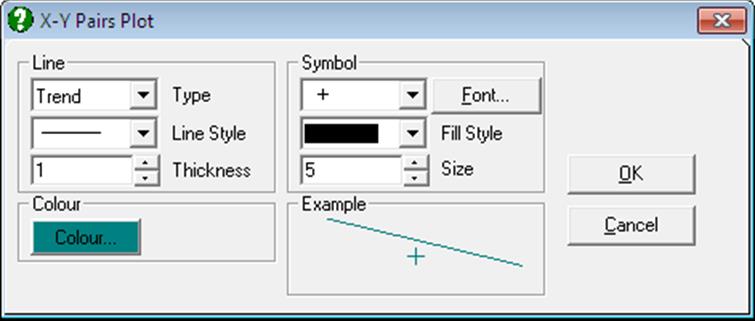
The Edit → Lines dialogue can be used to connect x-y points with lines or to fit a trend line on data with optional confidence intervals. The usual Symbol panel can be used to select any symbols in any colour. The Edit → Bars dialogue can be used to change the colour or filling patterns of the histogram bars.