9.3.3. Pareto Chart
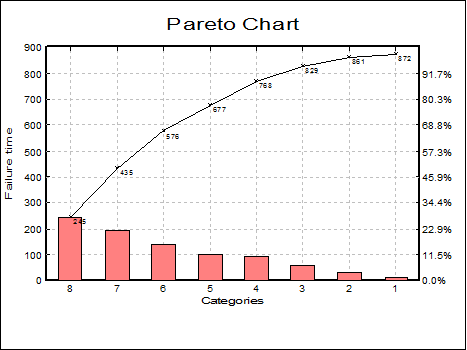
A Pareto Chart is a bar chart sorted in descending order with the cumulative totals shown above the bars. The chart is based on the Pareto principle, which states that quality losses are distributed in such a way that a small percentage of causes are responsible for the majority of the quality problems. This chart allows you to identify which areas are causing most problems. The Pareto chart is useful in comparing the process under investigation before and after the corrections are made.
Each row represents a different category. Select one column by clicking [Variable], which contains the number of defectives associated with each category. If a value is negative, zero or missing, then it is ignored in the analysis.
9.3.3.1. Pareto Output Options
The following output options are available:
Summary Information: This displays the row number, value, percentage, cumulative value and cumulative percentage in a table.
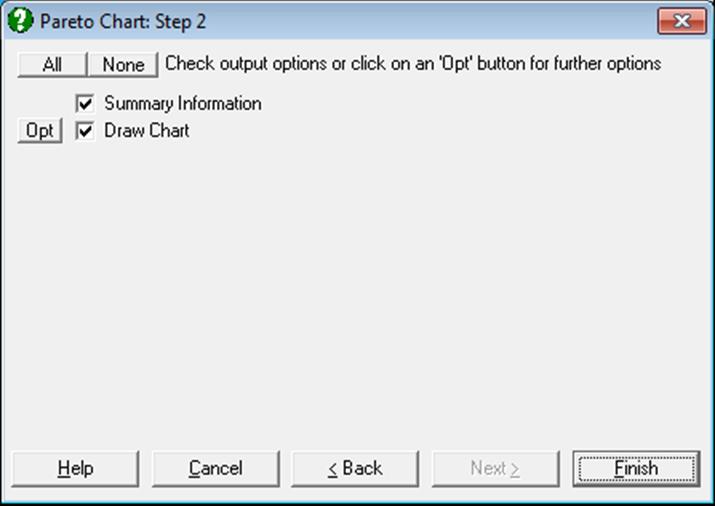
Pareto Chart: Clicking the [Opt] button situated to the left of the Draw Chart option will place the graph in UNISTAT’s Graphics Editor.
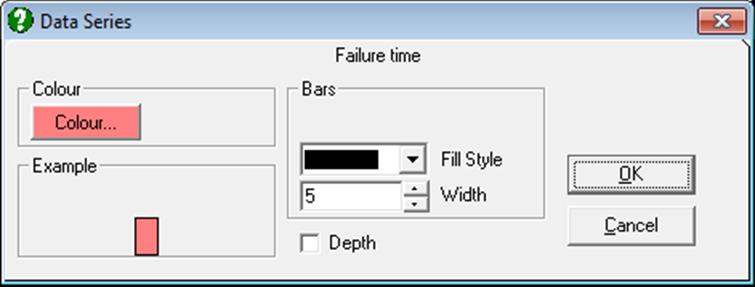
It is possible to control the appearance of bars using the Edit → Data Series dialogue.
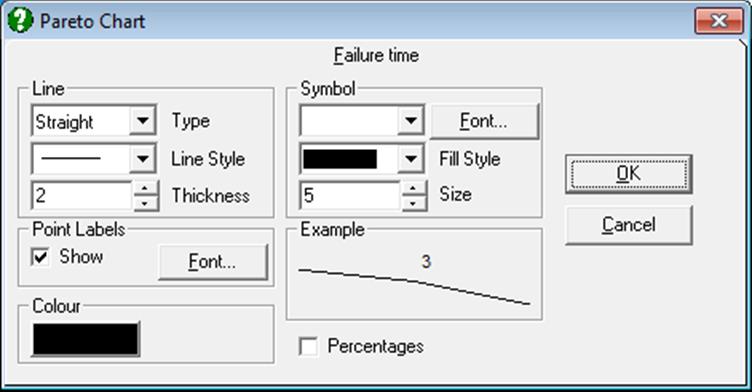
In the Edit → Line dialogue, the Point Labels / Show check box controls the labels displayed along the cumulative total line. If the Percentages box is checked then the cumulative percentages will be displayed. Otherwise, the cumulative values are displayed.
9.3.3.2. Example
Example 16.15 on p. 580 from Banks, Jerry (1989). Failure times of 8 components are given.
Open TIMESER and select Statistics 2 → Quality Control → Pareto Chart. Select Failure time (C17) as [Variable] and click [Finish].
Pareto Chart
Variable: Failure time
|
Label |
Row |
Value |
Percentage |
Cumulative Value |
Cumulative Percentage |
|
8 |
8 |
245.0000 |
28.1% |
245.0000 |
28.1% |
|
7 |
7 |
190.0000 |
21.8% |
435.0000 |
49.9% |
|
6 |
6 |
141.0000 |
16.2% |
576.0000 |
66.1% |
|
5 |
5 |
101.0000 |
11.6% |
677.0000 |
77.6% |
|
4 |
4 |
91.0000 |
10.4% |
768.0000 |
88.1% |
|
3 |
3 |
61.0000 |
7.0% |
829.0000 |
95.1% |
|
2 |
2 |
32.0000 |
3.7% |
861.0000 |
98.7% |
|
1 |
1 |
11.0000 |
1.3% |
872.0000 |
100.0% |