9.3.2. Attribute Control Charts
An attribute, as used in quality control, refers to a characteristic that does or does not conform to specifications. For example, in a computer assembly operation, computers are switched on after they have been assembled. They either work (conform) and undergo further tests or they do not switch on (non conform) in which case they are sent for repair.
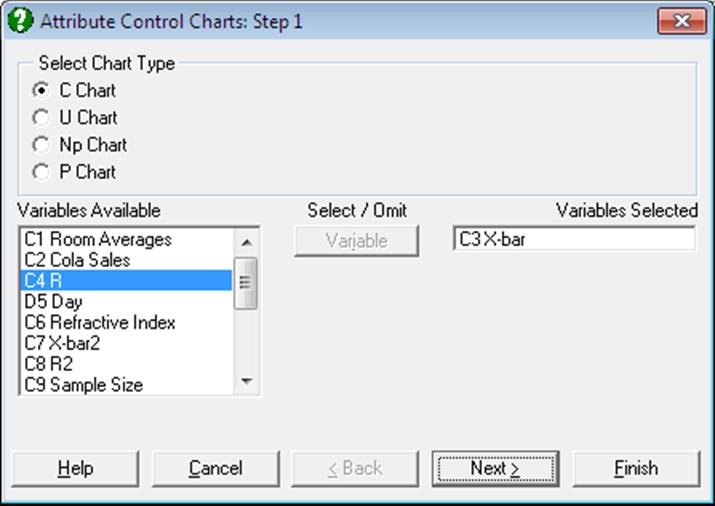
First select the type of attribute chart. Next, select one column for the number of non conforming cases in each sample by clicking on [Variable] and one column for the sample size by clicking on [Size]. Sample size is not required for the C Chart. Each row represents a sample.
9.3.2.1. C Chart
In this chart, the number of non conforming cases are plotted and the control limits are based on the Poisson distribution. This chart should be used when the non conforming cases are rare. The program does not ask for the sample size, but all samples should have similar sizes.
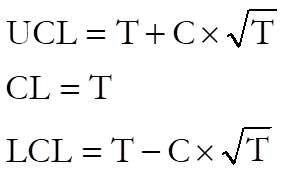
If LCL < 0 then set LCL = 0.
where:
· T is the target level. The default value is the mean of the sample values.
· C is control line parameter.
Example
Table 6.6 on p. 168 from Banks, Jerry (1989). Number of nonconformities on 22 samples of 50 EGA cards is given.
Open TIMESER and select Statistics 2 → Quality Control → Attribute Control Charts. Select C Chart and Nonconformities (C12) as [Variable]. On the next dialogue enter:
· 12.8636 Target Level
· 3 Control Line (* Sigma)
· 0 Warning Line (* Sigma)
· 0 Parameter (>1 MA, <1 EWMA)
and from the Output Options Dialogue select [Finish] to obtain the following output:
Attribute Control Charts
C Chart
Variable: Nonconformities
‘*’ denotes sample outside control limits
|
Sample |
Value |
LCL |
UCL |
|
1 |
12.0000 |
2.1039 |
23.6234 |
|
2 |
6.0000 |
2.1039 |
23.6234 |
|
3 |
14.0000 |
2.1039 |
23.6234 |
|
… |
… |
… |
… |
|
11 |
21.0000 |
2.1039 |
23.6234 |
|
* 12 |
28.0000 |
2.1039 |
23.6234 |
|
13 |
14.0000 |
2.1039 |
23.6234 |
|
14 |
15.0000 |
2.1039 |
23.6234 |
|
15 |
13.0000 |
2.1039 |
23.6234 |
|
* 16 |
2.0000 |
2.1039 |
23.6234 |
|
17 |
9.0000 |
2.1039 |
23.6234 |
|
18 |
10.0000 |
2.1039 |
23.6234 |
|
19 |
14.0000 |
2.1039 |
23.6234 |
|
20 |
11.0000 |
2.1039 |
23.6234 |
|
21 |
13.0000 |
2.1039 |
23.6234 |
|
22 |
16.0000 |
2.1039 |
23.6234 |
|
Target Level = |
12.8636 |
|
Control Limits = |
3.0000 x Sigma |
|
Sigma = |
3.5866 |
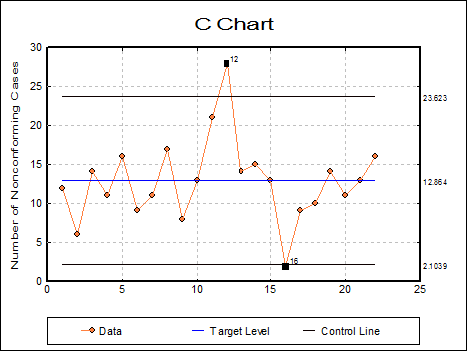
This chart shows that the process is out of control. It might be instructive to investigate any changes that occurred in the process when samples 12 and 16 were taken.
9.3.2.2. U Chart
In U Chart, the rate of non conforming cases is plotted. The control limits are based on the Poisson distribution. Therefore, non conforming cases should be rare. Unlike the Np Chart and the P Chart, the U Chart does not require that the number of non conforming cases is less than the sample size. Each item can have more than 1 non conforming feature; e.g. number of scratches per car door.
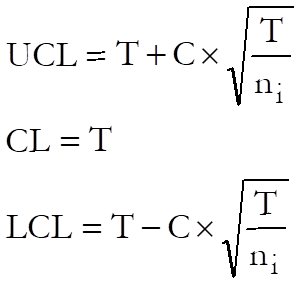
If LCL < 0 then set LCL = 0.
where:
· T is the target level. The default value is the total sample value divided by the total sample size, which is the weighted mean of the sample means.
· C is the control line parameter,
· ni is the size of each sample.
Example
Table 6.8 on p. 173 from Banks, Jerry (1989). Paint Blemishes on Left Front Doors are given.
Open TIMESER and select Statistics 2 → Quality Control → Attribute Control Charts. Select U Chart and Surface Area (C13) as [Size] and Blemishes (C14) as [Variable]. On the next dialogue enter:
· 5.86766 Target Level
· 3 Control Line (* Sigma)
· 0 Warning Line (* Sigma)
· 0 Parameter (>1 MA, <1 EWMA)
· 0 Use Average N (0 No, Else Yes)
and from the Output Options Dialogue click [Finish] to obtain the following output:
Attribute Control Charts
U Chart
Variable: Blemishes
Size: Surface Area
‘*’ denotes sample outside control limits
|
Sample |
Value |
LCL |
UCL |
|
1 |
3.5714 |
0.0000 |
13.7966 |
|
2 |
3.2258 |
0.0000 |
15.0967 |
|
3 |
4.7619 |
0.0000 |
13.7966 |
|
… |
… |
… |
… |
|
10 |
3.2258 |
0.0000 |
15.0967 |
|
* 11 |
14.2857 |
0.0000 |
13.7966 |
|
12 |
3.2258 |
0.0000 |
15.0967 |
|
13 |
1.6129 |
0.0000 |
15.0967 |
|
14 |
5.5556 |
0.0000 |
12.8603 |
|
15 |
9.5238 |
0.0000 |
13.7966 |
|
16 |
8.3333 |
0.0000 |
13.7966 |
|
17 |
8.0645 |
0.0000 |
15.0967 |
|
18 |
5.5556 |
0.0000 |
12.8603 |
|
19 |
6.4815 |
0.0000 |
12.8603 |
|
20 |
6.4516 |
0.0000 |
15.0967 |
|
Target Level = |
5.8677 |
|
Average Sample Size = |
0.8010 |
|
Control Limits = |
3.0000 x Sigma |
|
Sigma = |
2.4223 |
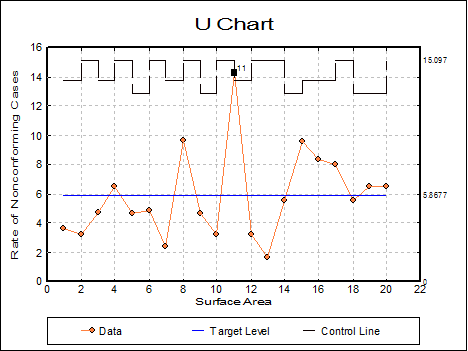
This chart shows that the process is out of control.
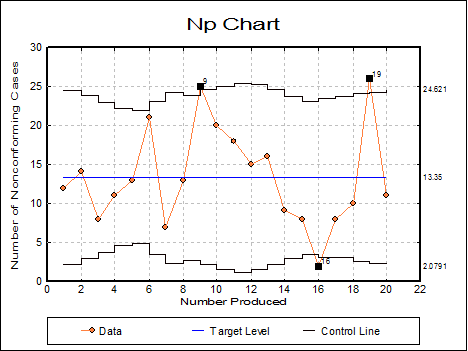
9.3.2.3. Np Chart
In this chart, the number of non conforming cases is plotted. The control limits are based on the Binomial distribution, so non conforming cases need not be rare. This chart requires that the number of non conforming cases is less than the sample size. The target level should change depending on each particular sample size. However, this is not the case in the Np Chart. So the sample sizes should be reasonably consistent. If sample sizes vary greatly then P Chart should be used instead.
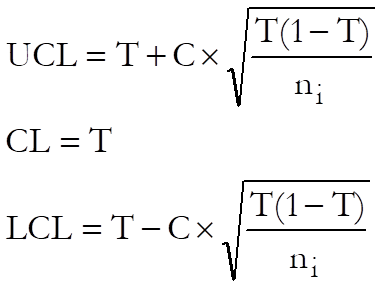
If LCL < 0 then set LCL = 0.
where:
· T is the target level. The default value is the total number of non conforming cases divided by the total sample size, which is the weighted mean of non conforming cases.
· C is the control line parameter,
· ni is the size of each sample.
Example
Open TIMESER and select Statistics 2 → Quality Control → Attribute Control Charts. Select Np Chart and Number Produced (C15) as [Size] and Nonconforming (C16) as [Variable]. On the next dialogue enter:
· 13.35 Target Level
· 3 Control Line (* Sigma)
· 0 Warning Line (* Sigma)
· 0 Parameter (>1 MA, <1 EWMA)
· 0 Use Average N (0 No, Else Yes)
and from the Output Options Dialogue click [Finish] to obtain the following output:
Attribute Control Charts
Np Chart
Variable: Nonconforming
Size: Number Produced
‘*’ denotes sample outside control limits
|
Sample |
Value |
LCL |
UCL |
|
1 |
12.0000 |
2.1924 |
24.5076 |
|
2 |
14.0000 |
2.8735 |
23.8265 |
|
3 |
8.0000 |
3.7069 |
22.9931 |
|
… |
… |
… |
… |
|
* 9 |
25.0000 |
2.1243 |
24.5757 |
|
10 |
20.0000 |
1.5936 |
25.1064 |
|
11 |
18.0000 |
1.1899 |
25.5101 |
|
12 |
15.0000 |
1.5290 |
25.1710 |
|
13 |
16.0000 |
2.1243 |
24.5757 |
|
14 |
9.0000 |
2.9710 |
23.7290 |
|
15 |
8.0000 |
3.5501 |
23.1499 |
|
* 16 |
2.0000 |
3.1937 |
23.5063 |
|
17 |
8.0000 |
3.0447 |
23.6553 |
|
18 |
10.0000 |
2.6100 |
24.0900 |
|
* 19 |
26.0000 |
2.4224 |
24.2776 |
|
20 |
11.0000 |
2.0791 |
24.6209 |
|
Target Level = |
13.3500 |
|
Average Sample Size = |
222.2500 |
|
Control Limits = |
3.0000 x Sigma |
|
Sigma = |
0.2376 |
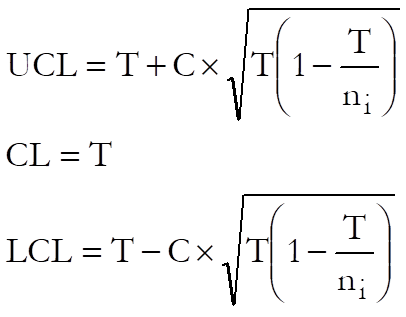
9.3.2.4. P Chart
In this chart, the rate of non conforming cases is plotted. The control limits are based on the Binomial distribution, so non conforming cases need not be rare. This chart requires that the number of non conforming cases is less than the sample size.
If LCL < 0 then set LCL = 0.
where:
· T is the target level. UNISTAT gives the total sample values divided by the total sample sizes. This is the weighted mean of the sample values.
· C is the control line parameter,
· ni is the size of the ith sample.
Example
Table 6.3 on p.156 from Banks, Jerry (1989). PC Production for July is given.
Open TIMESER and select Statistics 2 → Quality Control → Attribute Control Charts. Select P Chart and Number Produced (C15) as [Size] and Nonconforming (C16) as [Variable]. On the next dialogue enter:
· 0.0601 Target Level
· 3 Control Line (* Sigma)
· 0 Warning Line (* Sigma)
· 0 Parameter (>1 MA, <1 EWMA)
· 0 Use Average N (0 No, Else Yes)
and from the Output Options Dialogue click [Finish] to obtain the following output:
Attribute Control Charts
P Chart
Variable: Nonconforming
Size: Number Produced
‘*’ denotes sample outside control limits
|
Sample |
Value |
LCL |
UCL |
|
1 |
0.0490 |
0.0145 |
0.1056 |
|
2 |
0.0648 |
0.0116 |
0.1086 |
|
3 |
0.0437 |
0.0074 |
0.1128 |
|
4 |
0.0724 |
0.0022 |
0.1179 |
|
5 |
0.0897 |
0.0009 |
0.1193 |
|
6 |
0.1105 |
0.0084 |
0.1118 |
|
7 |
0.0295 |
0.0138 |
0.1064 |
|
8 |
0.0596 |
0.0118 |
0.1083 |
|
9 |
0.1008 |
0.0148 |
0.1053 |
|
10 |
0.0735 |
0.0168 |
0.1033 |
|
11 |
0.0619 |
0.0183 |
0.1019 |
|
12 |
0.0545 |
0.0171 |
0.1031 |
|
13 |
0.0645 |
0.0148 |
0.1053 |
|
14 |
0.0425 |
0.0111 |
0.1090 |
|
15 |
0.0423 |
0.0082 |
0.1119 |
|
* 16 |
0.0099 |
0.0100 |
0.1101 |
|
17 |
0.0383 |
0.0108 |
0.1094 |
|
18 |
0.0441 |
0.0128 |
0.1074 |
|
* 19 |
0.1106 |
0.0136 |
0.1066 |
|
20 |
0.0440 |
0.0150 |
0.1052 |
|
Target Level = |
0.0601 |
|
Average Sample Size = |
222.2500 |
|
Control Limits = |
3.0000 x Sigma |
|
Sigma = |
0.2376 |
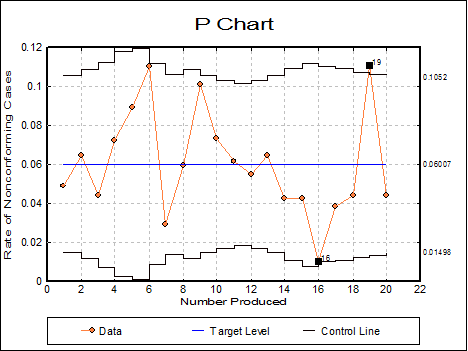
This shows that the process is out of control.